Winter 2026-27 Preview 2 months ago
August 9, 2026
- Analogs incorporate very strong El Niños with strong El Niños that had a negative PDO.
- The temperature forecast is a blend of analogs, which are very close to the blend of models.
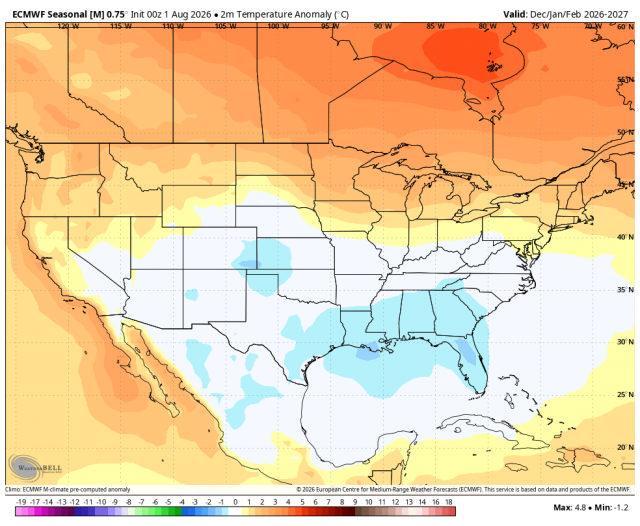
- The expected pattern favors cold and wet weather to the south of I-40, but increasing warmth and dryness farther to the north.
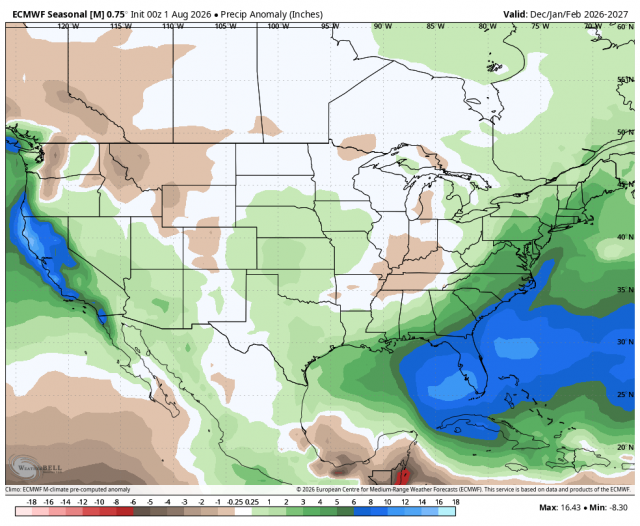
- Heavy precipitation is likely in the West, southern Plains, and along the East Coast.
- An extension of heavier precipitation into the Mississippi Valley is due to some of these El Niños having storm tracks quite far to the north.
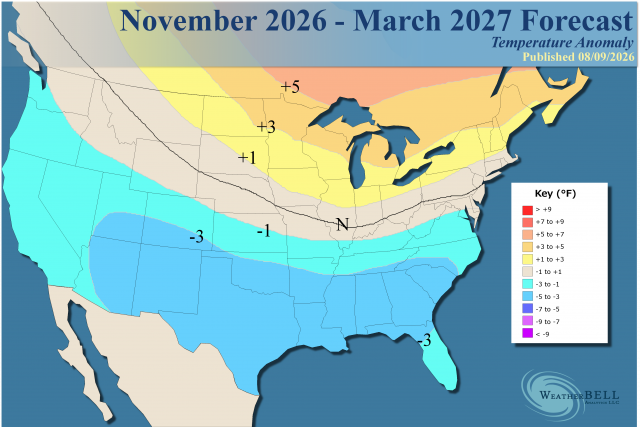
Analog:
.png)
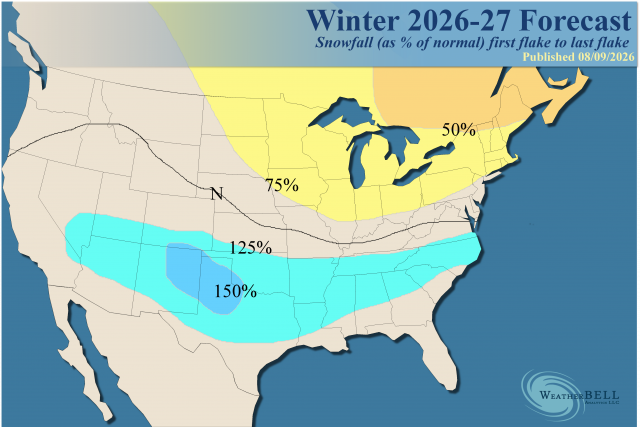
Selected City snowfall totals
| City | Snowfall Range (inches) | Compared to Normal |
| Boston | 25-30 | 60% |
| NYC | 20-25 | 70% |
| DC | 15-20 | Slightly above normal |
| Raleigh | 5-10 | 125% |
| Atlanta | 2-4 | 125% |
| Birmingham | 2-4 | 125% |
| Nashville | 4-8 | 135% |
| Charleston WV | 24-28 | Near normal |
| Pittsburgh | 30-35 | 75% |
| Buffalo | 75-85 | 85% |
| Cleveland | 40-45 | 70% |
| Detroit | 25-30 | 70% |
| Chicago | 25-30 | 70% |
| MSP | 40-45 | 90% |
| Des Moines | 35-40 | Near normal |
| Inianapolis | 10-15 | 50% |
| Cincinatti | 15-20 | 50% |
| Memphis | 3-6 | 150% |
| Little Rock | 3-6 | 150% |
| Dallas | 1-3 | Near normal |
| OKC | 5-10 | 110% |
| Kansas City | 15-20 | Near normal |
| St. Louis | 10-15 | 75% |
| Omaha | 20-25 | 90% |
| Pierre | 20-25 | 60% |
| Bismark | 30-35 | 70% |
| Butte | 50-55 | 90% |
| Cheyenne | 55-60 | 90% |
| Denver | 60-70 | 125% |
| Albuquerque | 10-15 | 150% |
| Lubbock | 15-20 | 250% |
| Flagstaff | 120-130 | 135% |
| SLC | 55-60 | Slightly above normal |
| Boise | 15-20 | 90-100% |
| Spokanne | 25-30 | 60% |
| Reno | 25-30 | 125% |
Analog Discussion
The choice of analogs for the winter rests upon being at least a strong El Niño in the Relative Niño Index, blending them with Negative PDOs that have occurred.
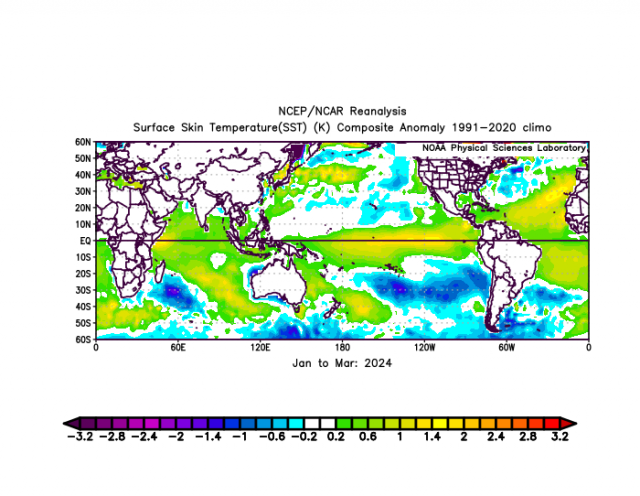
The last time we had something like this was during the winter of 2023-24. That winter had what has become the normal warm December, but then a major arctic outbreak showed up in January. However, as it came in, the MJO responded to the rapid anomalous warming that occurred around Australia and went right into strong warm phases, so the winter never came back to what it could have been.
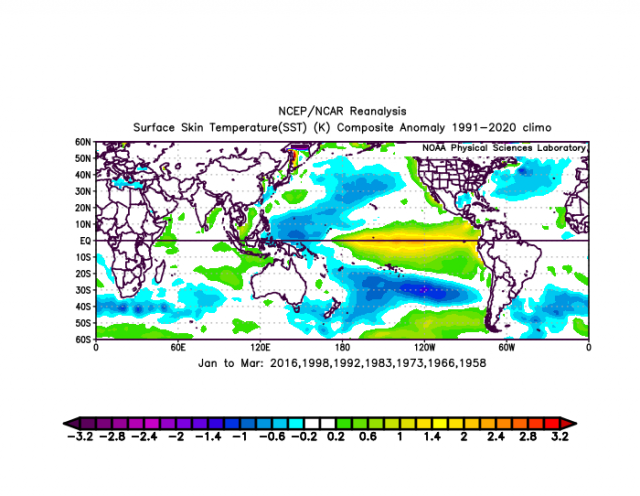
The strong El Niño SST analog for January to March:
What happened in 2024:
The MJO rotation in January to March 2024:
.gif)
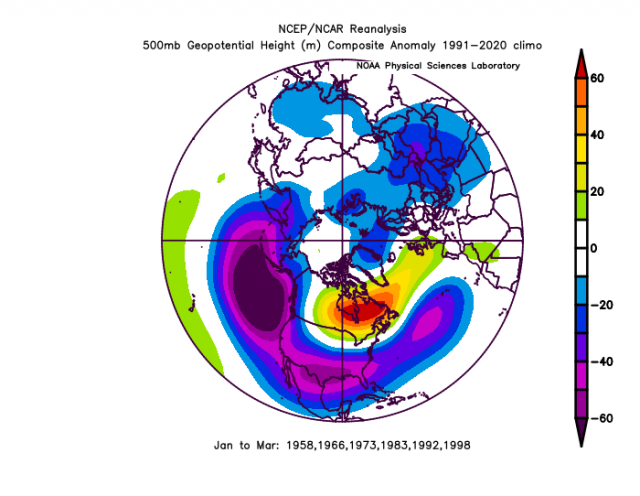
2015-2016 was a winter with 3 weeks of major winter weather, including a monster snowstorm in the East. In both the 2023-24 and 2015-16 El Niño events, the 500mb pattern was anomalous-looking compared to its predecessors:
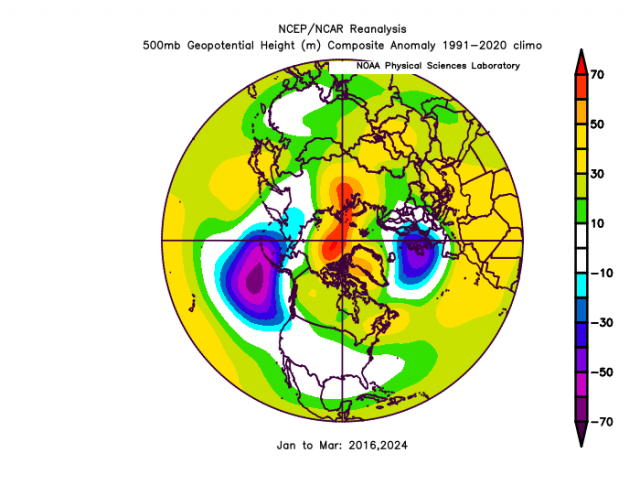
The predecessors:
In 2015-16, the MJO went into colder phases as the coldest, stormiest part of the winter showed up.
.gif)
- 1997-98 was a warm, wet winter for most. It actually had a very low amount of economic impact from weather. Interestingly enough, November and December started cold. As mentioned, Decembers in recent years have usually been warm, as you will see below.
- 1991-1992 produced a short-lived cold period but overall was a warm winter.
- 1982-83 had one major blizzard in February within a short-lived period of a cold and stormy pattern in the East. In the South, it was a cold, stormy winter centered in Texas.
- 1972-73 was almost snowless in the East, but was a big winter across the South.
- 1965 and 1966 both wound up colder than normal for January-March and had some legendary storms.
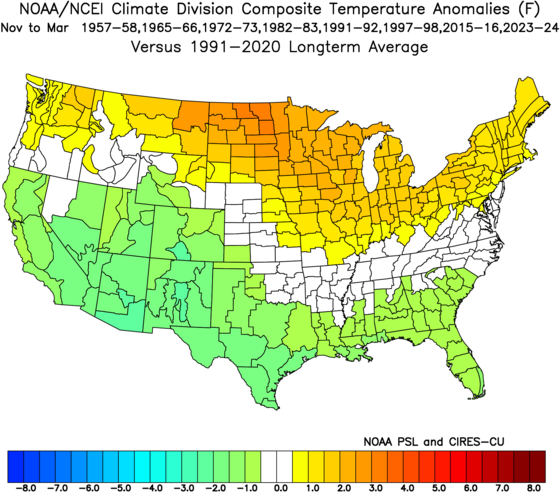
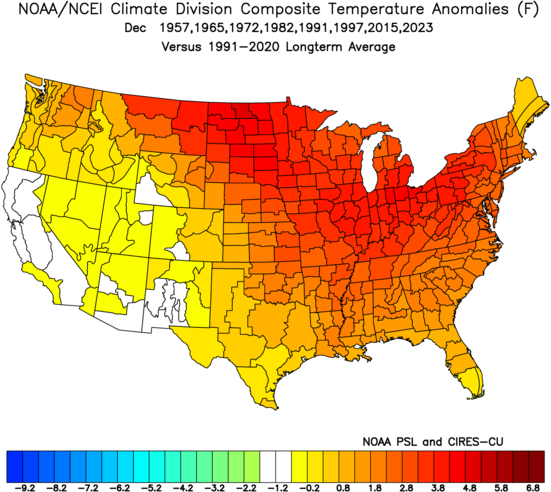
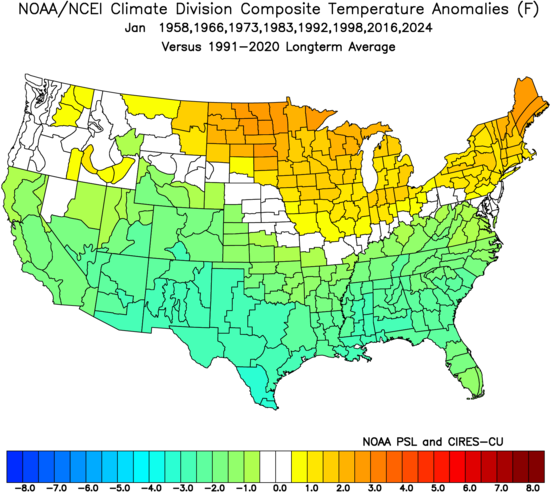
So there is quite a variance in these types of winters, but usually the northern part of the nation has the warmest weather (relative to normal). The analogs below will show that.
The bottom line is the colder part of the winter is expected to be later, rather than in December.
So the 500 mb analog for this winter (which includes all analogs):
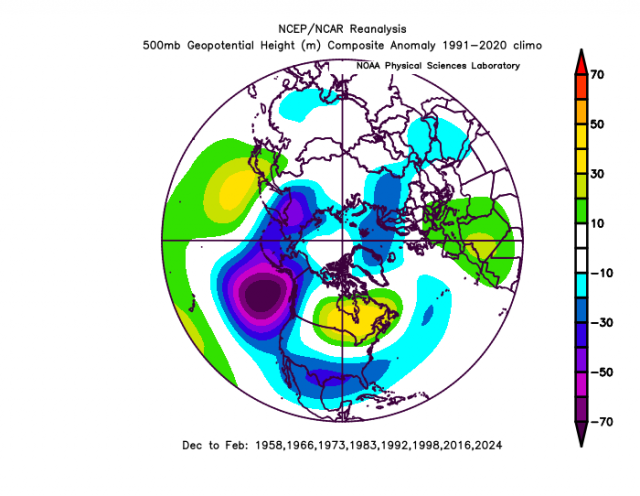
November through March temperatures:
November through March precipitation:
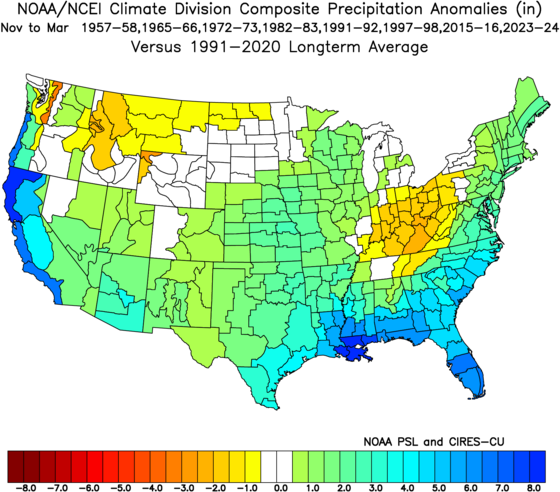
November temperatures:
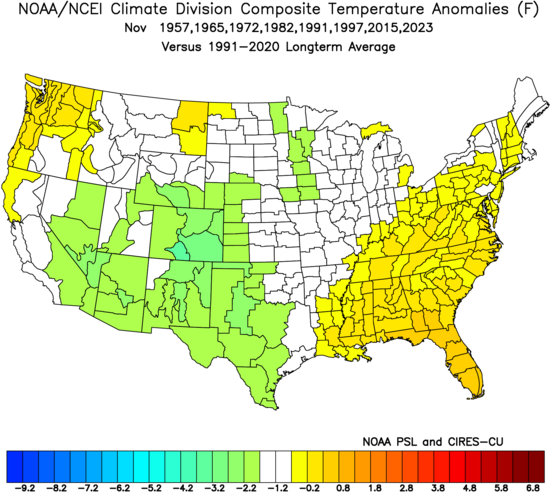
December has the strongest tendency to be warm:
January:
February:
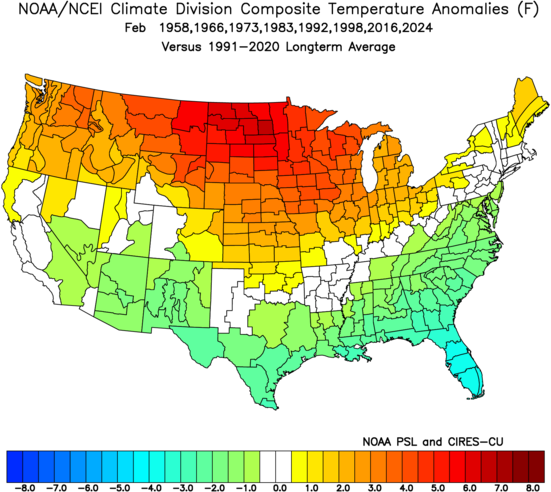
March:
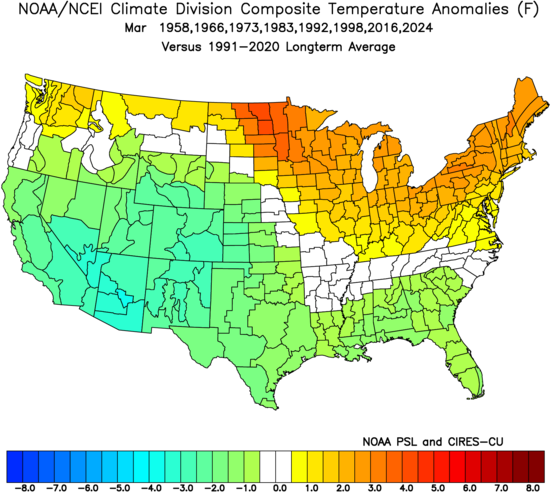
Model Discussion
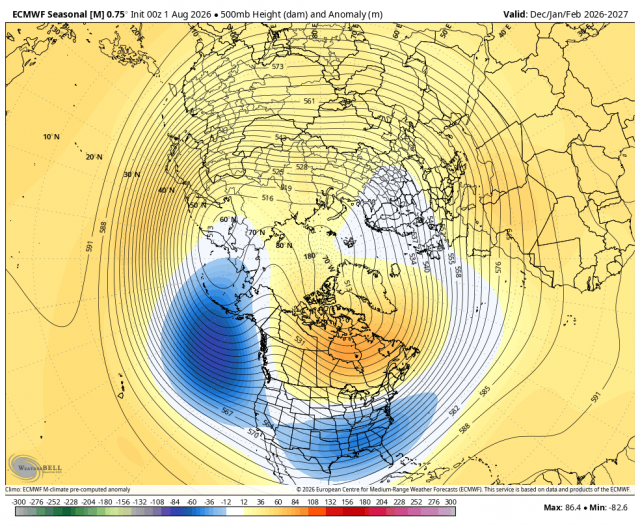
The 500 mb pattern for December-Febraury from the Euro Seasonal:
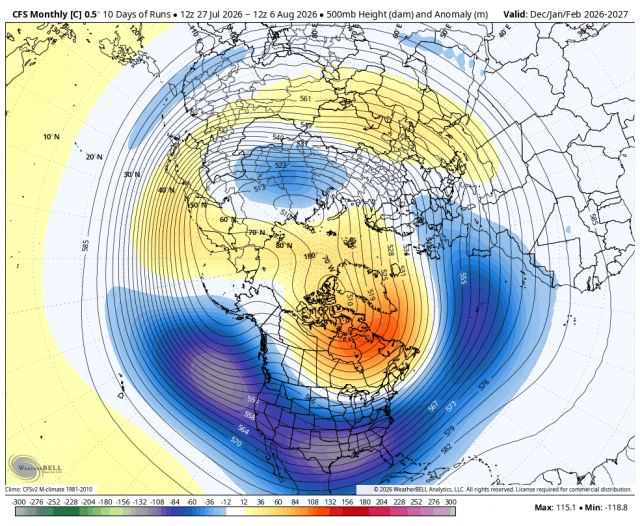
CFSv2:
Canadian:
.png)
This has the center of the positives over western Canada and less trough over the U.S.
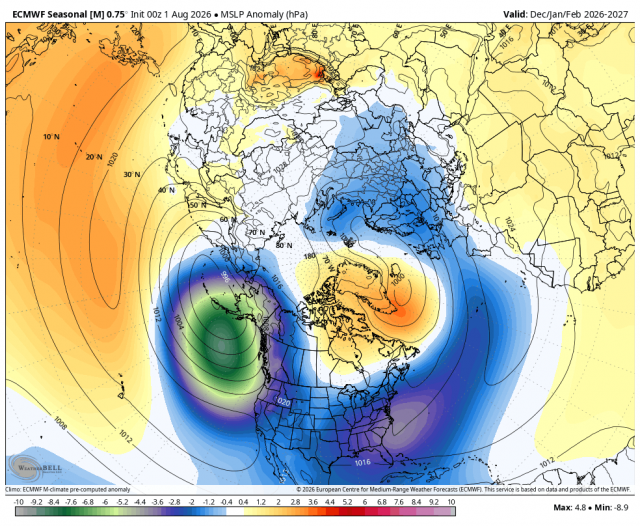
Notice the Euro's Sea Level Pressure pattern:
Canadian:
.png)
CFSv2:
.png)
So snow lovers may be licking their chops with what is a pronounced southern storm track. The question is, how much cold air will be available?
The Euro (in °C):
Canadian:
.png)
That makes little sense to me.
CFSv2:
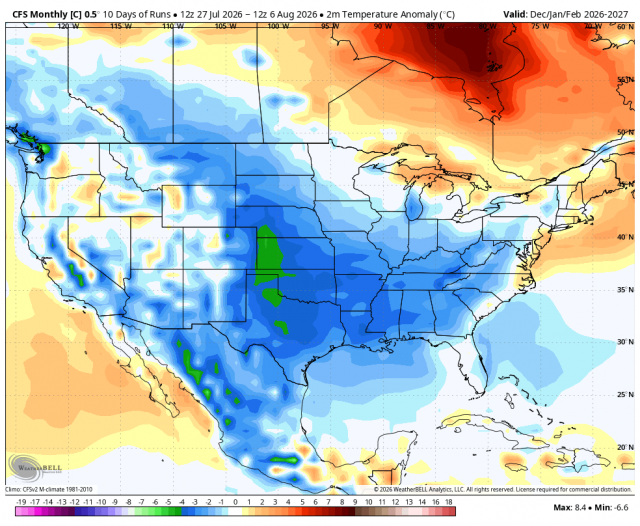
A Euro and CFSv2 blend looks better.
For precipitation, the Euro Seasonal looks like this:
CFSv2:
.png)
Canadian:
.png)
This should put an end to the drought in the Southwest and lead to the threat of some major snowstorms. As you will see in our snowfall forecast, we are centering the biggest snowfall anomalies in the south-central part of the nation into the southern Rockies. The biggest uncertainty is the East Coast. It will be close enough to the storm track and heavy precipitation, and temperatures will likely tilt colder if there is more snow upstream. Suppose instead of 1 big storm, a couple of smaller ones, and a lot of rain, you can get 2, 3, or 4 storms in a row, as we saw in 1966. The greatest threat of higher-than-average snow is in the Mid-Atlantic.
You notice my hand-drawn is colder than the analogs. That is because I am incorporating models. The CFSv2, for instance, for January to March looks like a blend of the same period in 1988 (the tail end of a moderate to strong El Niño) and the infamous Snowmaggedon El Niño of 2009-10. The Mid-Atlantic may be the place to watch for colder and snowier weather to show up, as many of the biggest winters there were El Niños.
CFSv2:
.png)
A blend of those winters:
.png)
Now that is really close.
The Verdict
The forecast blends 7 selected El Niños with modeling to come up with a first look at a winter, one with plenty of potential for a stormy pattern to feed back and get a snow cover through the mid-latitudes of the country, cooling temperatures. In addition, the CFSv2 looks like a blend of two winters that had widespread cold January-March periods: 1988 and 2010.
If you are trying to find analogs to the model solutions rather than just running to models, you would find different years than only the stronger El Niño events with a negative PDO. It's interesting to note that the last time this happened was at the tail end of the positive AMO that ruled from the 1930s into the 1960s. Complicating the whole thing is the idea that even though we have those similar signals, the actual base temperatures of the oceans and the air are quite a bit warmer. Remember, the global air temperature is not a physical parameter, though it is portrayed that way by many in the meteorological and climate media. Global (mean/average) temperature is a statistical construct derived from many local measurements, not a true physical parameter or thermodynamic state variable of the Earth as a whole. It is very useful as a scoreboard, though, showing how warmth is outdueling cold when you total all that up. In the end, you have to realize that someone has to be cold, and even very cold, to keep the score relatively close.
The CFSv2 seems to be aiming that cold arrow at the U.S., so as I get closer, I will start weighing the El Niño's relative closeness to what we are seeing. It's rare when one or two similar ones take over for the entire time, rather than just a blend of different historical patterns. Odds favor November to be cooler, perhaps much cooler, than what could be a very warm December, with the real Waterloo of winter being January to March.