WeatherBELL Premium

May 12, 2017
- This is a challenging forecast.
- The analogs suggest low activity overall but high impact in the U.S.
- There are contradictions between the Euro forecast and the analogs.
This is a very difficult year to forecast, far more than last year. I think the major hurricane drought is going to end this year. The concern, though, is a bit different with increased intensity near our coasts.
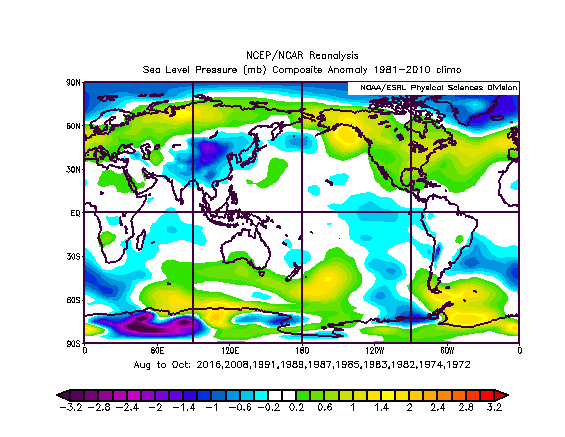
When I first looked at the ECMWF MSLP forecast for the heart of the hurricane season, this is opposite of what the means have looked like over the past 11 years.
.png)
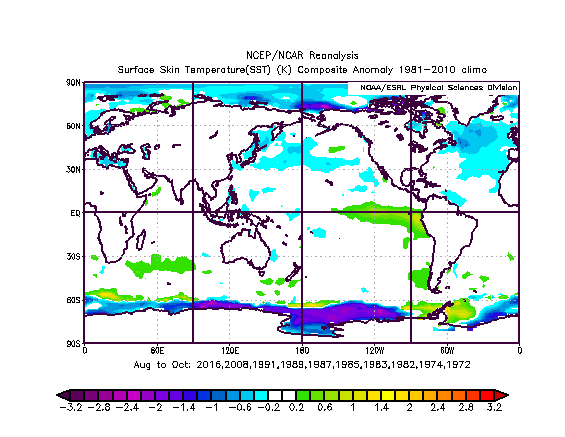
The SST forecast has warmer than average water in the MDR and a hint at cooler water to the north in the central and eastern Atlantic:
.png)
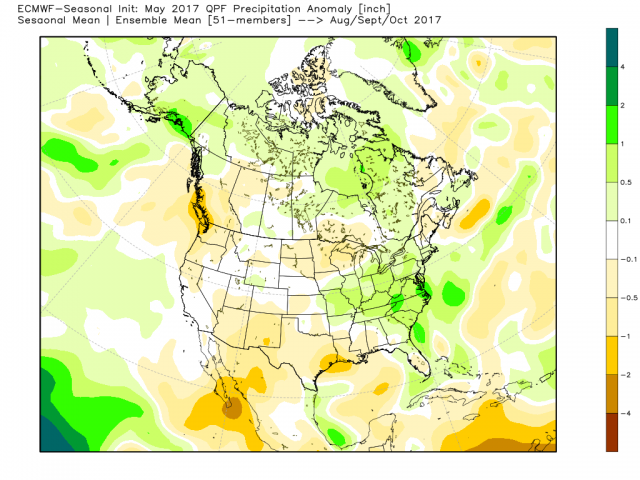
The precipitation forecast.
.png)
Zoom in:
My reaction was that the model is hinting at a bigger season than what we had previously forecasted. However, I then crunched the numbers and went over every season since 1950 to come up with the 10 best analog years. I looked at the pressures across North America, the North Atlantic and the Gulf of Alaska and there were three big hit years: 1985, 2008 and 1989. Last year showed up but the other six were the who's who of wimpy years in total ACE. So the pressure map in those seasons looked remarkably like the ECMWF forecast:
Here is the catch - the SSTs were much colder in the blend of those years:
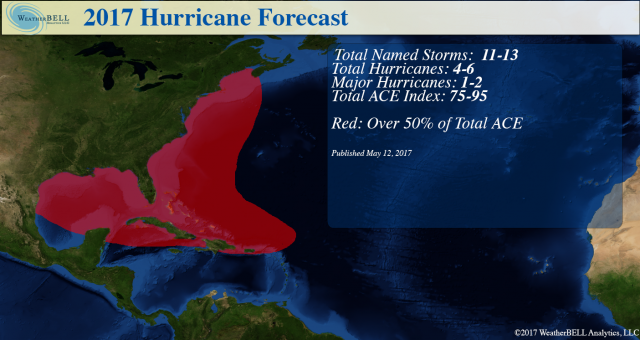
So we have the ACE index from my analog years at 71.1 near where Colorado State is. However, given the big hitters in there and the warm state of the Atlantic, I have chosen to keep our ACE where it is (compensating for the 1 ACE point that Arlene provided already). The major hurricane number remains.
When we look at where the storms hit and how many, it's alarming to some degree. Given how low the ACE was in those years, there were a lot of storms that hit land.
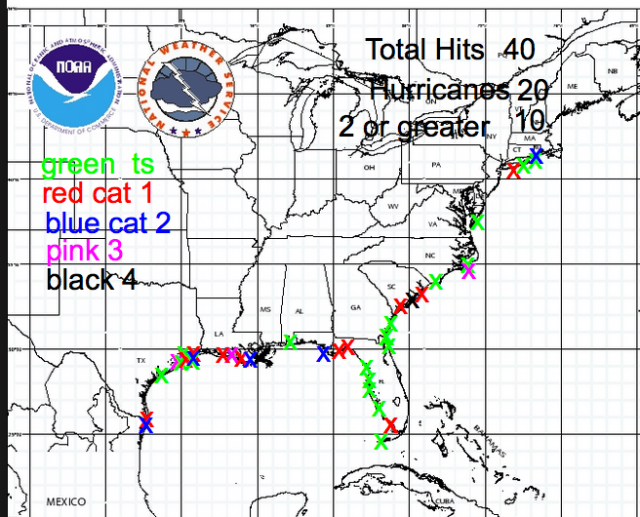
The suggestion here is that the northwestern Gulf of Mexico better watch out. The other two areas are the Carolinas and New England. It's amazing that in a pattern with these analogs, the Bahamas and the East Coast of Florida seem to be left alone. However, the precipitation charts would suggest that there will be above normal precipitation close by.
The area the analogs have the most action, is quite dry. So there is a contradiction here. The similar pressure patterns produced a lot of hits where the model thinks it's going to be drier. The rainfall where the modeling has it at this time of year is the modeling hinting at tropical activity affecting the eastern U.S.
The message is that the farther to the west and north the storms are, the stronger they may get. While the implication of higher pressures even in much of the tropical areas would be smaller storms, that is a problem since small, intense storms such as Alicia can show up. The El Niño is not all that strong and should be central Pacific centered. If the Atlantic has a warm look as the Euro has, the bigger years would be more prominent (Tom Downs points out the Euro does like to look warm in the longer term and then back off).
The Verdict
The ACE may be deceptively low overall compared to the threat that exists for the U.S. coast. The analog produces total storms per year at slightly under 10, but it hits at 40% of the name, it stands to reason that we may be in for a "bang for the buck" season.
I think we really have to watch for early season mischief this year out of the Gulf of Mexico or Caribbean. The last time we had rain like this in the spring was 1957 (this April was second only to that) and Audrey came a calling. What normally happens is there is a flurry to start, then we back off for a while. The El Niño is going to be more in the central than eastern Pacific, so while we cannot ignore it, the Atlantic will be left to its own whims.
A difficult, challenging season is on the way.
POWER AND IMPACT SCALE
I believe that the scale I have developed, incorporating pressure and pressure tendency, is a much better indicator of the impact that a storm will have over a larger area than the Saffir-Simpson scale. Let's take Ike and Sandy. The scale uses the pressure categories 1-5 and the wind categories 1-5 on the Saffir-Simpson scale to come up with a total 1-10. A rapid deepening storm, more than 3/mb hour, gets an extra point tacked on, 1mb/hour a half point, and vice-versa for weakening. The physical reason for this is that a rapidly deepening storm is indicative of feedback mechanisms working so well that the storm is able to produce the maximum wind it's capable of. Conversely, if weakening rapidly, it's likely not to be able to bring that to the surface.
Ike at 953 mb was in the mid-range of Cat 3, "3.5" for pressure. Winds were reported at 110 mph, which is about 2.75 for wind. This made Ike on my scale a 6.25, which is a major hurricane. Gustav was about the same. Do you think for one second 75 years ago before all the categorizing we see now, those storms would not have been recorded as majors? More importantly, they did major damage. By the way, even though it might be technically true by way of the Saffir-Simpson scale, I believe it's not right to claim that the U.S. has not been hit by a major hurricane since 2005. Gustav, Ike and Sandy all were major impacting hurricanes and had the damage to prove it (though over a larger area). This is why the overall power of the storm in relation to other storms is approximated much better with my scale.
Sandy, at landfall, had a 946 mb pressure (verified by land observations at a barometer that was calibrated to within 0.5 mb several times when I was home at Somers Point, NJ), which is about a pressure of 3.75 on the Saffir-Simpson scale. Sandy was weakening off its peak several hours before, so the pressure is adjusted to 3.25. Winds were at 85 mph, which is a 1.5. Sandy goes down not as a Cat 1 hurricane but a combined 4.75, which is healthy Cat 2 (if we are going to chop it in half). This ranking certainly does it more justice.
While I am not holding my breath about this being adopted, I will from time to time reference it so we can have a better idea of the total picture of the storm. It's the old argument, the slugger (my power scale) or the boxer (the more "proper" Saffir-Simpson scale).
Note on the lack of large major hits
Since 2006, no majors on the Saffir Simpson scale have hit the U.S. As an aside, my power and impact scale disagrees with this statement, as Gustav, Ike and Sandy were borderline majors in my determination. No matter, it’s still way below what has been alluded to in almost hysterical terms. Keep in mind, we saw politicos use a run-of-the-mill and slow-to-develop Hermine in the middle of the hurricane season as an example of global warming, indicating a startling ignorance to hurricane history, the same ignorance on display with the shrill cries of “worse than ever” out of New England. People were apparently unaware of the spectacular hits the East Coast used to take.
Let’s look at the period 1950-1960, when hurricanes were indeed blasting the U.S. coast from Florida and northward (this does not include the 1950 mega season).

Sea surface temperature (SST) anomalies, against the last 30 years, were slightly warmer than normal near the U.S. South Atlantic coast.

It was cold in the North Atlantic and cold to the west of South America. The Arctic was cold too. The point is, where is the best place for heat buildup and its subsequent release for the heart of the hurricane season? Near the U.S. coast. Now let’s look at the mean surface pressures.

We have higher than normal pressure over Canada, near normal over the Atlantic into the U.S. The alley of lower pressure is near where the water is warmer, but with higher pressure relative to the lower pressure surrounding the bulge northward of low pressure, it means systems coming toward the U.S. run into higher pressures in the means. This means there is more convergence of air in the means as a storm approaches the coast. It’s not unlike what you see in Nor'easters. When the big high won’t get out of the way and the storm tries pushing northward into it, the air flows more strongly into the storm. Neutral to high pressure in the means to the north and around storms means the storm can maintain intensity.
The hurricanes of the 1950s did not weaken dramatically coming to the coast as we have seen with many storms in the non-major era, the most recent example being Matthew, which never could get back to the strength it showed in the Caribbean. When pressures are lower to the north of a storm moving northward, the convergence is not as strong and the inflow into the storm is not as great. So what is needed is an environment, removed from the storm center of course but still having an influence, where pressures are higher. If it’s warmer to the north in the means, this environment is not there. The recent non-major era SST:

The SSTs are all warmer to the north (in the Arctic, it’s saying the temperature of the ice is warmer than it was, but that is still going to distort the pressure field).
Look at the mean surface pressures and remember, what is the use of a hurricane if the redistribution of heat from the tropics into the temperate regions is already taken care of?

There is nothing but low pressure across the North, and the crucial pattern of having the lowest pressures relative to normal in the tropics is not there! This means a hurricane coming toward land, in the means versus what happened in the 1950s, is heading toward what has been much lower pressures. The result is that in the means, the convergence is less (remember, when you are talking about very small changes in the tropics, it is a big deal with tropical cyclones). We know that when they come out of the tropics they are in effect doing what their natural process makes them to do: releasing bubbles of heat into the temperate regions for redistribution. If that is being take care of, then what’s the need?
What can we conclude from this?
1) This hypothesis is something that should be researched by people whose job is to research all aspects of weather and climate. It is typical of what I do, because I want to know why, and so this is a proposal and challenge to those who should look at this. There are many ideas in the private sector that only see the light of day when we real-time test them in a forecast.
2) This does not mean we cannot get situations where everything lines up, and the extreme event happens. It’s just that they have been less frequent and this may be the reason. We have very warm water next to our coasts and one big high going by to the north and a storm that looks like nothing. Within 36 hours, it can blow up into a major hurricane as it comes to land. Recognizing the pattern that can produce this it what is crucial. In the means, we can plainly see that lower pressure in the areas to the north of the Tropics and over the U.S. has been correlated to the lack of majors on the Saffir-Simpson scale. Even on my scale, it’s a very quiet time. Again, in the large sense, why do you need that redistribution of heat if it’s already being accomplished?
3) I suspect, and this is something I have spoken on in the past, there is a distortion of global wind and pressure patterns that is leading to the ACE Index not responding overall in the way that has been opined in the people pushing the idea it’s worse than ever. I also suspect they have no idea to go look at things like this, but over the past two winters I have been burned on the disconnect between the mid-levels and the low-levels, so I have really dug in deeper. It is a major forecast problem now in my opinion.
4) There is opinion out there suggesting warming would yield less activity. While that is beyond the scope of this, I have listed a few examples. Like it or not, the last 10 years have not been extreme and this may be the reason — warming has caused a basic shift in the pressure patterns during hurricane seasons that do not favor the kind of major attacks we had in the 1930s, ‘40s and '50s (large, strong Hurricanes) . While the adjustment took place early this century, the majors developed, but keep in mind that Katrina, Rita, Wilma and Ivan all were off their peaks when they reached the U.S. Lili collapsed coming to the Louisiana coast in 2002.
In fact, every LARGE major hurricane, unlike let’s say Hazel (1954), Donna (1960), Carla (1961), Camille (1969) and Andrew (1992), weakened coming into land. The ones that did “blow up” were smaller, weaker storms like Humberto (2007). Charley did too, but again, it was a very small storm in overall size, a fist of fury. It seems like the bigger the storm is in size, the more it will weaken coming to the coast. Part of that is inflow from the land in the bigger storms, but the other part may simply be the large-scale distortion in pressure patterns. It at least deserves a look, in my opinion, and I wanted to share this idea with you.