Public Winter 15-16 Forecast 10 years ago
August 2015
- Overall, a snowy, colder than normal winter is expected in the South and East
- Core of winter will be later rather then earlier
- December could be very warm with February very cold
- El Niño is a big influence but not the only factor
The old forecast, issued in April looked like this:
.png)
It is a pick your poison situation, in my opinion. The new forecast is colder from the southern Plains to the Mid-Atlantic states, but much warmer in the northern Plains:
.png)
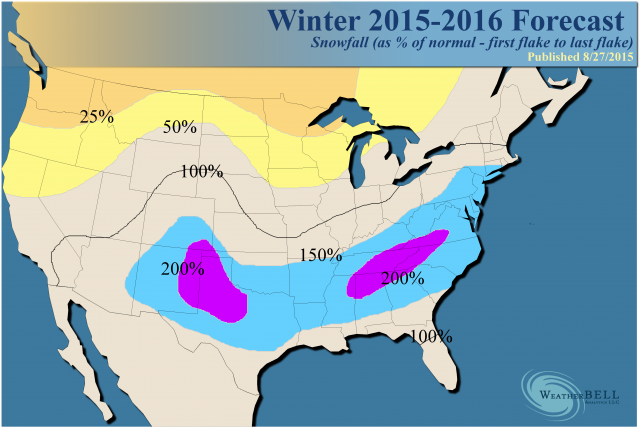
As far as snow, it should be a non-winter from the Northwest into the northern Plains, but a big winter for the South into the I-95 corridor. The old idea:
.png)
Note that the scale has changed in our new forecast, and we have introduced a two-times-normal area.
New forecast:
Analogs & Models
Our method of an independent consensus ranked 1957-58 first, 2014-15 second, 1997-98 third, 2002-03 fourth and 1972-73 fifth. Also factored in were 1919-20, 1982-83, 1991-92, 1994-95 and 2009-10.
There are several of those winters that are very warm. Look at the SST pattern of all the analog years:
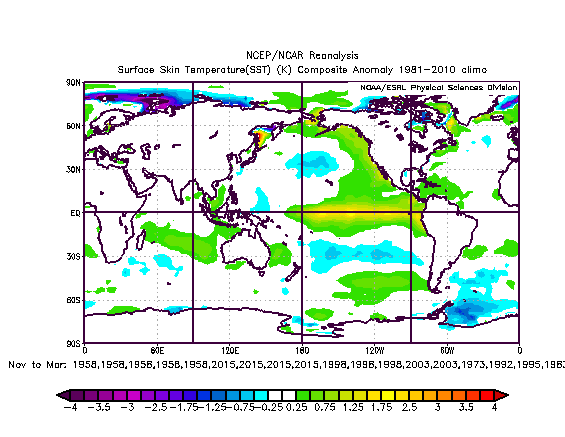
Now look at the warm winters of those years:
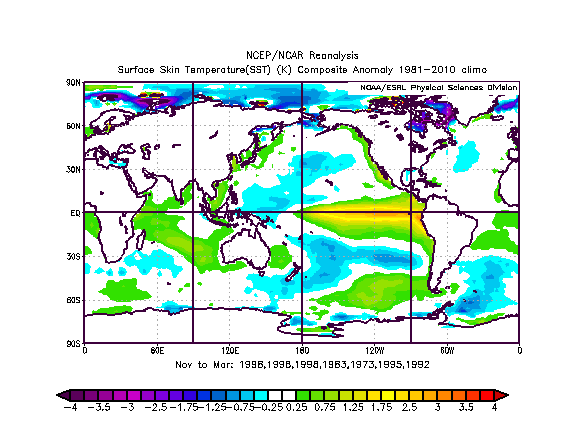
Two things stand out. 1) the core of the warmest water is near the west coast of South America and 2) The Pacific is much cooler. This is likely the problem with the CFSv2 model, as it is trying to stick cooler water farther to the east:
.png)
This combined with its maddening tendency to to place troughs over warmer water will likely lead to that model being wrong. It is much like 1997 in its forecasted upper level pattern:
.png)
However, there are no other models agreeing with it! In addition those warm versions had more cold water than it does too, which supports more of a pattern that forces the northern ridge eastward. The Euro long range forecast is much more similar to our analogs (and like all the other modeling).
The U.S. constructed analog forecast through January looks very much like the Euro for winter!
.gif)
The upper level response is much like the Euro model - much farther to the west with the ridging.
.gif)
If you take out the warm years, you can argue that the Euro SSTs look a lot like those members that had colder winters.
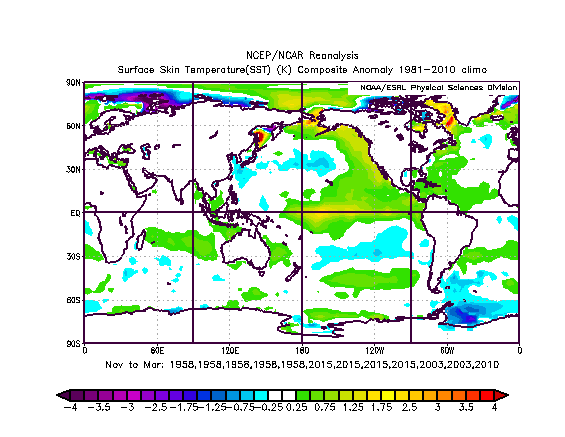
So, if the warmer versions become less of a factor, the winter will be colder than we have. As it is, the Euro model (which cannot be shown) shows the western trough offshore and the seasonal progression of this would likely mean a cold East for the January-March period. In addition, the model has a monster ridge over western Canada with arctic ridging, and it will be very hard to hold cold out of the U.S. as the winter matures. Again, the Euro model forecast is much different from the CFSv2 model and much closer to our thinking, even with warmer winters factored in!
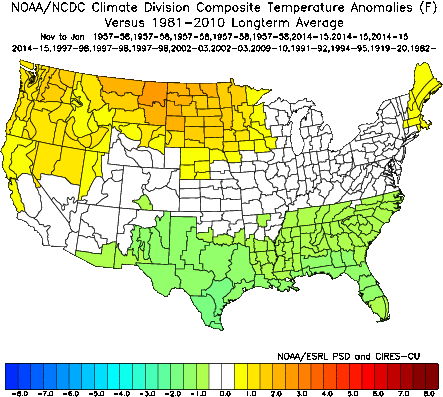
To make our point even further here is the pure analog evolution.
November through January:
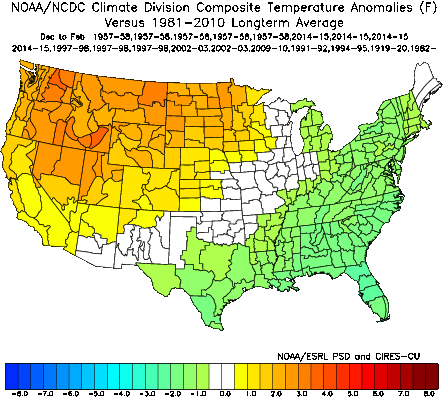
December through February:
Obviously with a winter temperature forecast that looks different, we are factoring in modeling ideas that are colder farther to the southwest.
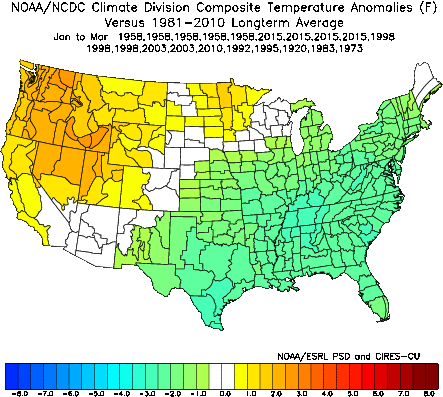
Look at the January-March period:
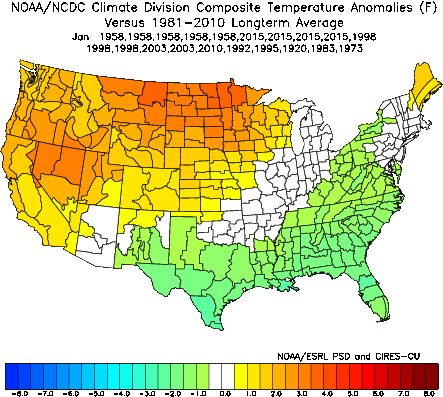
The monthlies reveal a very warm December:
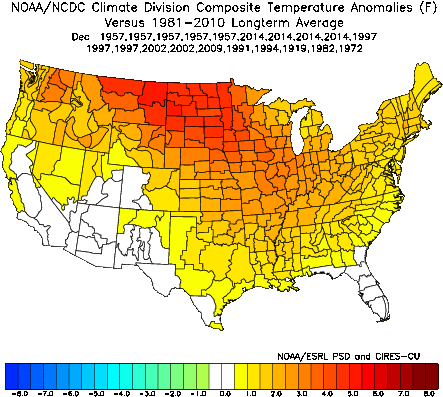
There are a couple of uncertainties with this that give a cause for pause. The most prominent would be a late November typhoon recurvature that would lead to a responding trough over the East or Plains (at least for awhile). Nonetheless, there is obviously strong analog agreement for warmth.
January cools, however:
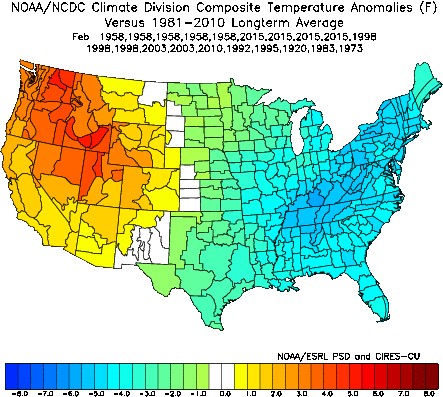
February looks like it's the coldest month:
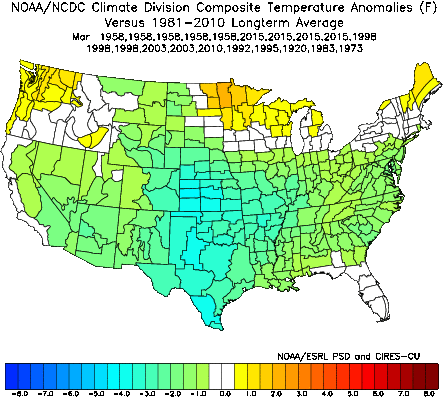
Spring is slow to come as March is also cold:
The Verdict
Winter is going to be a challenge. I don't believe in broad-brushing El Niños to a standard one size fits all composite. Our blend of analogs, even with warm winters factored in, gives a major cold and snowy winter over the South and into the East. This will be a back-weighted winter. While there is a chance the warmer ideas win out overall, of more concern is December not being as warm, requiring an adjustment to the entire package to the colder side.
Something new, the Winter Weather Index
Here is how this works, and it's experimental. If you think it gives you an up, I will continue to use it and refine it based on client feedback.
Here is what I settled on as the formula for determining how bad a winter is. The negative of the temperature anomaly (in other words 8°F below normal would be a minus minus 8, or +8) plus the percentage of snowfall relative to normal divided by 50. So 200% of normal would add a value of 4 to the original 8, giving you a Winter Weather Index of 12.
.png)
The negative values are tricky, since we are using a scale where 100% or normal is set to 0. So 50% of normal would be equal to 200%, but negative. Of course this means that in the South, the biggest factors when there is no snow will be temperature. When there is snow, because snow is such a big deal, it takes over.
Let's take Dallas for example. Suppose it's 4°F below normal with 400% of normal snowfall. That would be a severe winter, because it gives us a total of 12.
Now lets take Minneapolis. Suppose it's 4°F above normal with 25% of normal snowfall. That is the opposite of 400% of normal so we have a -8 value. We are using the opposite sign for temperature, so they would be given a -12 on the scale, or a very benign winter for them.
You can do it for months and seasons, too. Boston last February was -12.7°F and 600% of normal snowfall. This would be a wild 24.7 rating (crippling) which no other winter month can compete with. So snow and cold gets thrown in together. January was 3°F below normal with 300% of normal snowfall, which gave them an index value of 9 (severe). December was 3.5°F above normal, with snowfall only 10% of normal, giving them a -14 (very benign). December blunted the winter total, but it still wound up being an average of 7, which is of course a nasty winter.
We are going to real time battle test it this winter. I don't know if I explained this very well, and chances are people will see it, hammer it, put out their own ideas, and that's fine. It's something I have been working on, so for now, here it is. It's likely to be refined as we go on over the years.
Here is the seasonal outlook this year (higher numbers, worse in relation to normal):
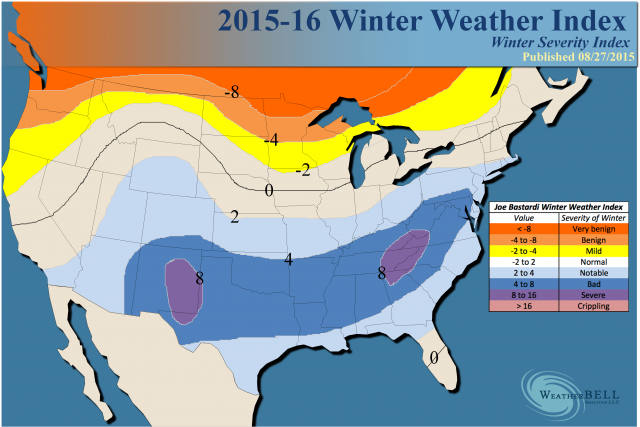
This is meant to be a visual, to give you a look at where winter is wildest or mildest in relation to average.