Prelim 2021-22 Winter Outlook 4 years ago
August 9, 2021
- We are expecting a fast start to winter over the East.
- There is strong analog support from models through mid-winter.
- Overall the coldest weather should be centered on the Great Lakes.
- Please read for details on WeatherBell's proprietary research.
This is not that dissimilar to last year - and with good reason. It is based on a set of analogs that includes last year.
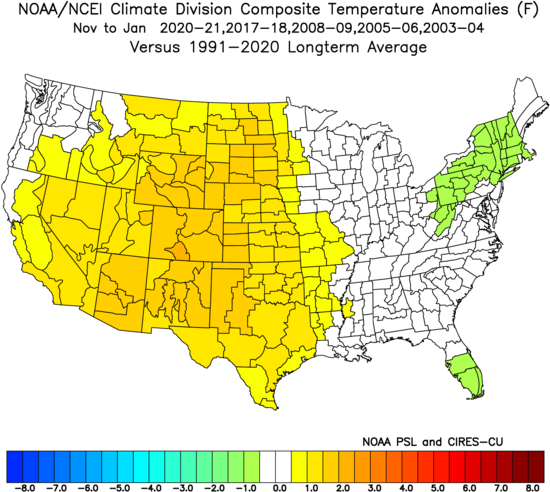
Our analogs are the winters of 2003-04, 2005-06, 2008-09, 2017-18, and 2020-21. The commonality of these include:
- Colder than average Mays preceding the period across much of the nation.
- A high amplitude MJO in the preceding spring, which carried into the hurricane season. Cold phase MJO springs usually have big U.S. impact seasons behind them, and that pattern carries into an early winter correlation.
- Summer SSTs and hurricane season activity, which signals the tendency for Greenland blocking in winter (especially early).
This also means a rough early winter in western Europe.
Let's look at that hurricane season SST analog:
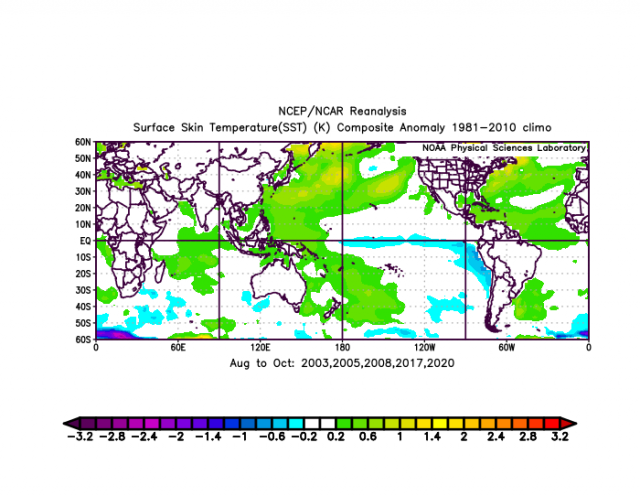
Notice the warmth in the northwestern Atlantic. In the heart of the hurricane season, that supports ridging at 500 mb over southern Canada and into the northwestern Atlantic. This usually leads to higher than average impacts on the U.S. coast. It also is a source for heat to be pumped northeastward.
Keep in mind the analog years you see were determined by the preceding Mays and the MJO tendencies that occurred in those springs. So we were formulating the forecast for next winter starting in the spring. That has appeared on our Premium site for a few months now. I did want to see where models were trying to go before finalizing a forecast, to get some objective support.
Also, note La Niña. La Niñas, like El Niños cannot be broad-brushed. They produce different outcomes based on the total global picture, including how we get to where we are going. Some of the worst winters in the East, where La Niñas are commonly portrayed as warm, have been La Niña winters. The most graphic example was the big-hitting winter of 1995-96 after the big hurricane season that year.
The theory is the global pattern that produces a cold May in the U.S. and a high amplitude MJO, left to its own natural evolution, will lead to a certain type of winter, especially the front half. Then, the seasonal jet gets strong enough so it can force destructive interference; through feedbacks and stochastic events, along with the natural seasonal change, the pattern breaks in midwinter. It's why some of the winters in the analogs years you see go opposite ways - 2003-04 had one of the coldest Januarys on record in the Northeast while 2005-06 was one of the warmest ones across the nation. If we wanted to stack the deck cold, we could throw out 2005-06 and substitute 1995-96, but I feel recent winters plus the uncertainty that happens with time needs to be accounted for.
The August-October SST Euro forecast:
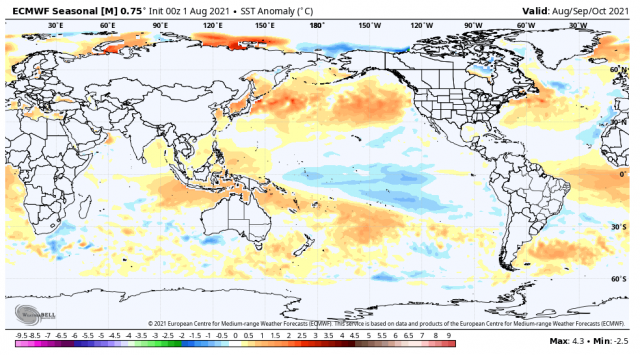
Note the warmth in the northwestern Atlantic, the cool central tropical Pacific, and the warm tongue coming off Japan into the north-central Pacific. What this tells us is the model, as of August, is backing up our flow chart that started this past spring.
When we go to the 500 mb analog, we get this for November-March:
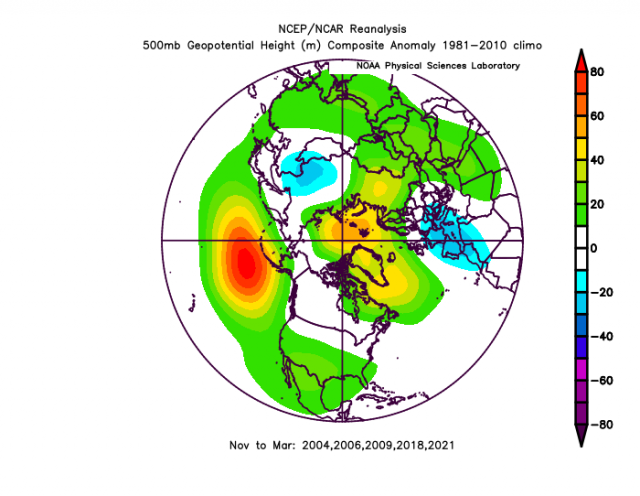
The way we get the overall mean is notable. November-January:
.png)
Let's then look at the latest European seasonal forecast stacked against that analog.
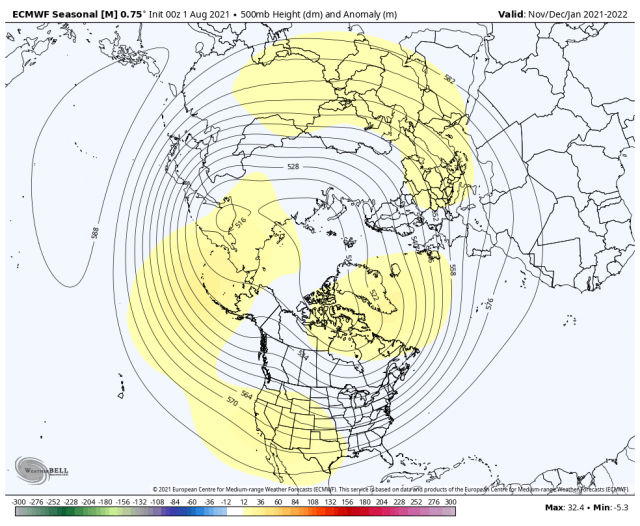
The analog looks similar to the Euro seasonal forecast. In fact, that is flat-out spooky close. The model does not go out beyond December-January. but has this:
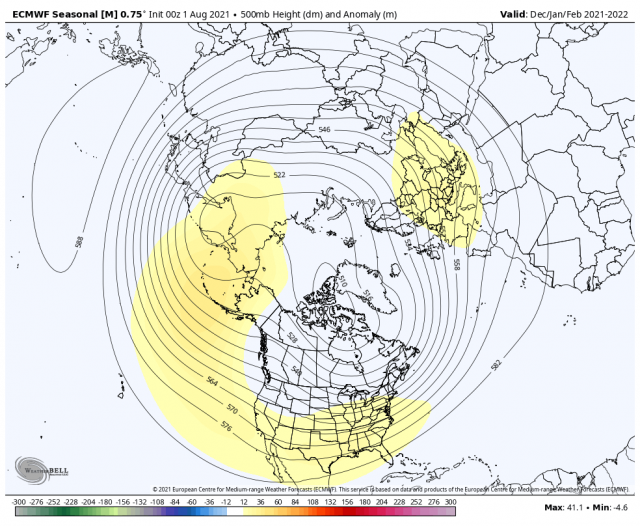
So by midwinter, it's breaking down the blocking and trying to pull the trough back. This is a notorious feedback error on the Euro, and while it may be right, I like our analogs through this period:
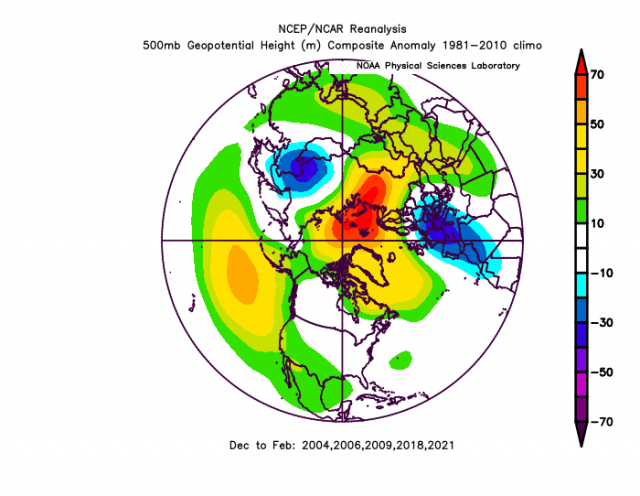
They too are trying to pull the trough back but in a way similar to last year.
What is really wild is the agreement about December. First of all ensemble models in the longer term, due to their nature, tend to only "hint" at where it might be cold, as they tend to wash it out. So what I like to do is see where it has it warm and then figure out where there is going to be a cold response. Think about this. If the global temperature is above normal (it is) then there still has to be compensating cold somewhere. Suppose you look at this 500 mb pattern for December:
.png)
Chances are the warmer areas will be warmer. Where it's just looking neutral will be colder. The position of the warmth to the north of Alaska and near Greenland, along with the hints of a trough in the Gulf of Alaska, western Europe, East Asia, and along the East Coast all mean that all those areas may be colder than normal. What does our selected analog look like for December?
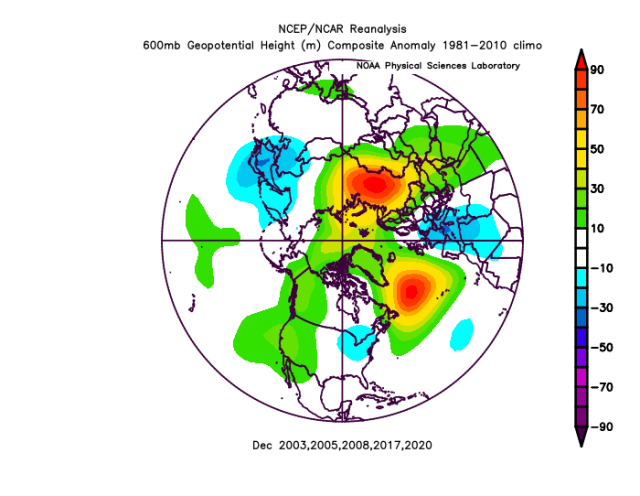
There is the trough over the East, centered on the Great Lakes.
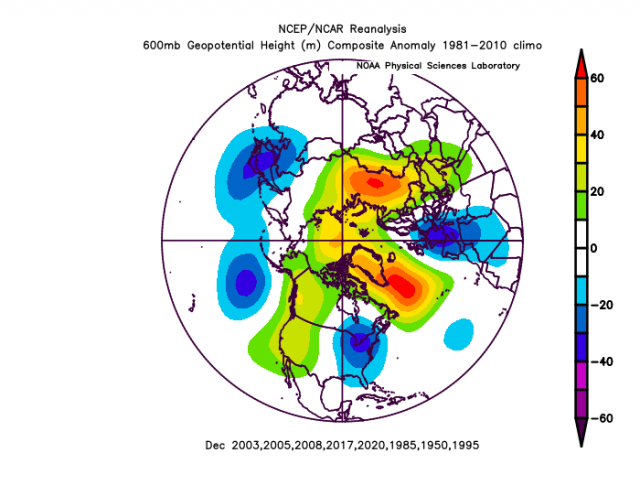
Note that there are some other years I have not thrown in (1950, 1985, and 1995). If we use them it gets flat out severe:
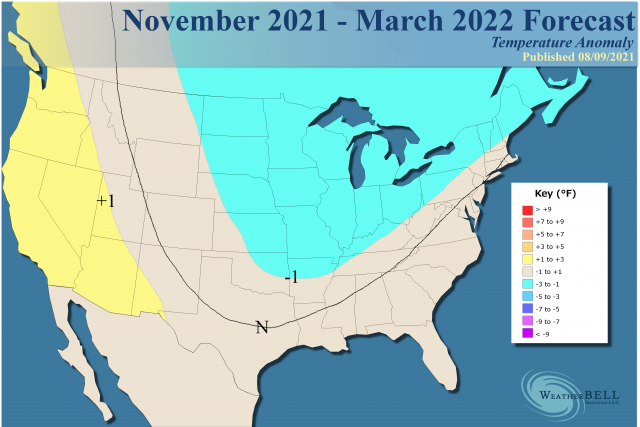
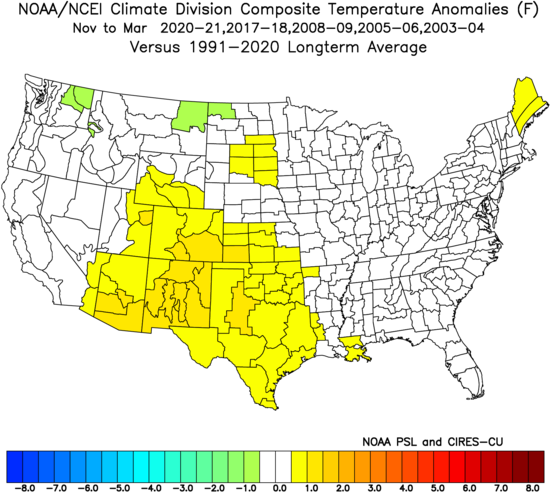
So we come up with a 5-month analog temperature pattern like this:
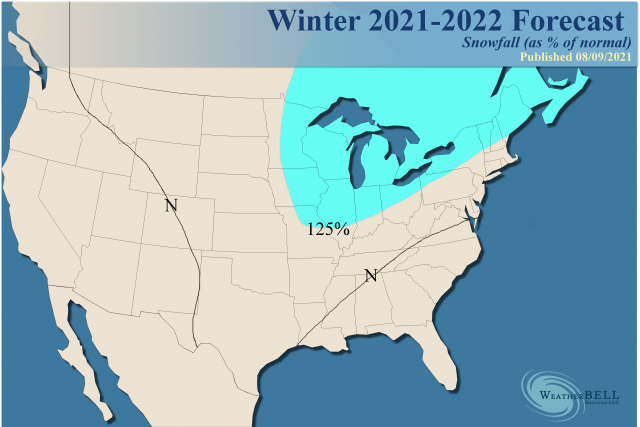
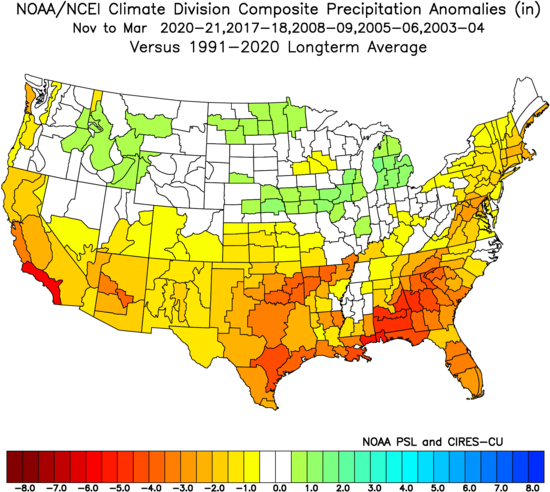
Precipitation:
Last year we saw how three weeks of cold air intrusions into Texas can change the whole picture despite an overall warm winter.
Note our November-January temperatures:
The heart of winter:
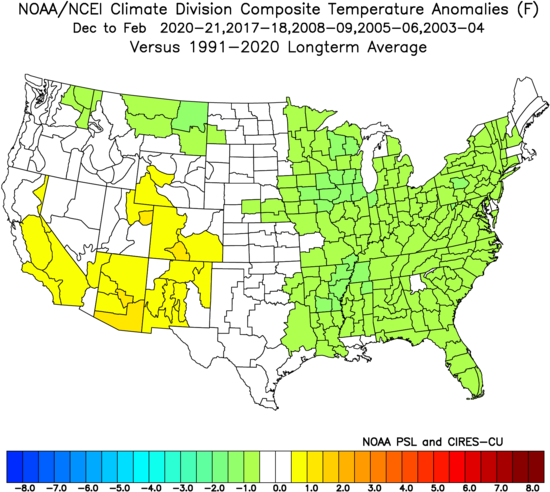
January-March:
.png)
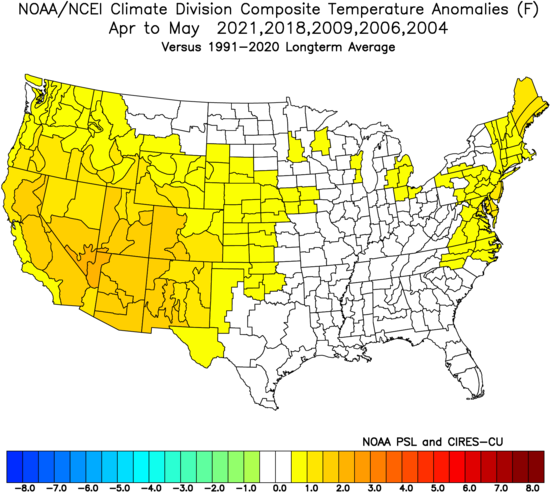
Of late, winters have been running well into spring especially to the north. The following April and Mays tend to vary because you have a lot of near-normal conditions but interestingly enough, not a lot of warmth (outside the West) for us being in a warm era.
For the individual months, a lot of times November winds up a bit warm but sudden flips occur that lead to a cold December. Novembers:
.png)
Your strongest cold correlation and analog is December:
.png)
January:
.png)
February:
.png)
March:
.png)
So it appears to be a pendulum that swings roughly every 30-45 days! Novembers are warm, December cold, Januarys are warmer and February is colder but farther back to the west. March then warms and April and May is a coin flip. If May the following year turns out warm and there is an El Niño and weak hurricane season, December 2022 will also likely be warm! There is a strong correlation there.
The Verdict
Overall it's a very bullish signal for early winter. I have left out of the analog some heavy pre-21st-century big-hitting winters. If those would get into the package, it would seal the deal. There is enough variance and swing, so prepare for bursts of higher than normal wintery weather, followed by a backing off. The wintery period will outduel the milder periods for the end result being a bit snowier than normal (population-weighted) with near-normal temperatures overall.
The antics of the MJO will be huge. Each winter weekly update will be dealing closely with that, as it's a huge driver. Models unfortunately are horrible at forecasting it, but I hope you have noticed that since the spring of 2020 we have had skill in hitting what it's up to. The MJO has also been a big help in 1-2 month forecasting for everything from summer cooldowns to hotter periods and hurricanes. After seeing last winter and the forcing we saw, a valuable lesson was taught and what I decided to do is start constructing this winter's ideas this past spring. I am showing you some of the links here and so the lesson of last year may have given us some knowledge as to how to deal with this year. Obviously, any future event is not etched in stone. Given how bad modeling is I should probably not be happy it agrees with the flow chart analogs we are using. For now, that is a good sign, though.