D'Aleo-Examining Global Tropical and Extreme Weather Death Trends 14 years ago
September 27 07:05 AM
Villarini, G., Vecchi, G.A., Knutson, T.R. and Smith, J.A. 2011. Is the recorded increase in short-duration North Atlantic tropical storms spurious? Journal of Geophysical Research 116: D10114, doi:10.1029/2010JD015493.
A paper in the Journal of Geophysical Research authored by a team of leading hurricane researchers (Villarini et al., 2011) examined the historical record of tropical storm observations from the Atlantic Ocean, focusing on the number of tropical storms whose entire lifetime was less than two days. The authors' termed these very minor storms "shorties." The identification of shorties is one element of the tropical cyclone record that could be significantly impacted by changing observational methodologies and technologies, as short-duration storms are presently identified much more readily than they were prior to the satellite era, which really began around 1966.
If the Atlantic tropical cyclone history is divided up into "shorties" and those that are longer lasting, something very interesting emerges. Over the entire record, there is a big upward trend in the number of "shorties" but there is no trend in the annual number of "longies" (Figure 1)
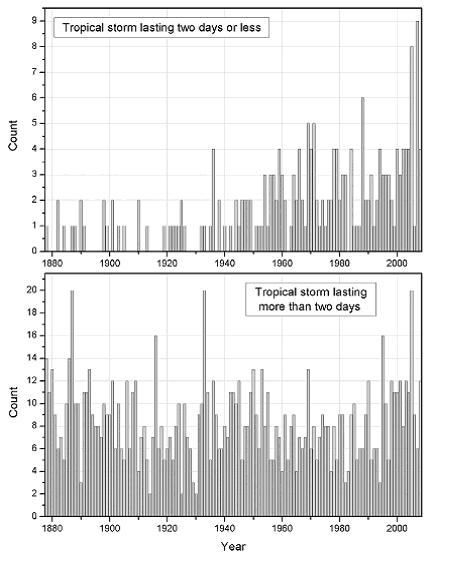
Figure 1. Time series of the number of North Atlantic tropical storms lasting (top) 2 days or less (shorties) and (bottom) more than 2 days (longies) (from Villarini et al., 2011).
This agrees with work done by Landsea (2007) who did a bias-corrected time series of tropical storms, subtropical storms, and hurricanes to take into account undercounts before the advent of geostationary satellite imagery in 1966 and new technology available since about 2002.
Villarini et al. conclude their paper by saying:
"Based on our results, it appears that the long-term record of the basin-wide shorties is sufficiently contaminated by spurious components to mask any climatically induced variation within the raw data. Moreover, based on these results and those of Vecchi and Knutson [2008] it is unlikely that a homogeneous record of Atlantic tropical storm counts would contain a statistically significant positive trend since the late 1800s. Our results provide a context for interpreting studies exploring trend behavior in the North Atlantic tropical storm activity starting prior to the 1940s. In particular, the conclusions of certain studies reporting large secular increases in North Atlantic tropical storm activity in which shorties are included [e.g., Holland and Webster, 2007; Mann et al., 2007] could be affected by what we interpret as likely spurious nonphysical trends unless an alternative physical explanation can be uncovered for the pronounced increase in shorties starting from the middle of the 20th century."
Improved technologies have improved our ability to detect and warn of both violent local storms and hurricanes. It appears very likely that this better detection has been responsible for apparent trends in frequencies of these storms frequently attributed to global warming.
Additional References
Holland, G.J., Webster, P.J., 2007: Heightened tropical cyclone activity in the North Atlantic: Natural variability or climate trend? Philos. Trans. Roy. Soc. Math. Phys. Eng. Sci., 365A, 2695-
Landsea, C. W., 2007, Counting Atlantic Tropical Cyclones Back to 1900, EOS, Transactions American Geophysical Union, 88, 18, 197-208
Mann, M.E., , T. A. Sabbatelli, and U. Neu, 2007: Evidence for a modest undercount bias in early historical Atlantic tropical cyclone counts. Geophysical Research Letters, 34, L22707, doi:10.1029/ 2007GL031781.
Vecchi, Gabriel A., Thomas R. Knutson, 2008: On Estimates of Historical North Atlantic Tropical Cyclone Activity*. J. Climate, 21, 3580-3600. doi: 10.1175/2008JCLI2178.1
-------------------------------------------------------------------------------------------------------
Our friend Ryan Maue has a recent paper
Global tropical cyclone frequency and energy has decreased and are at near historic record lows
Despite predictions to the contrary, during the past 6-years since Hurricane Katrina, global tropical cyclone frequency and energy have decreased dramatically, and are currently at near-historical record lows. According to a new peer-reviewed research paper accepted to be published, only 69 tropical storms were observed globally during 2010, the fewest in almost 40-years of reliable records. Furthermore, when each storm's intensity and duration were taken into account, the total global tropical cyclone accumulated energy (ACE) was found to have fallen by half to the lowest level since 1977.
Reference: Maue, R. N. (2011), Recent historically low global tropical cyclone activity, Geophysical Research Letters. 38, L14803, 6 pp.,doi:10.1029/2011GL047711
In his new paper, "Recent historically low global tropical cyclone activity", Dr. Ryan Maue, a meteorologist from Florida State University, examined the last 40-years of global hurricane records and found strikingly large variability in both tropical cyclone frequency and energy from year-to-year. Since 2007, global tropical cyclone activity has decreased dramatically and has continued at near-historical low levels. Indeed, only 64 tropical cyclones were observed globally in the 12-months from June 2010 - May 2011, nearly 23-storms below average obliterating the previous record low set in 1977.
On average, the North Atlantic including the Gulf of Mexico and Caribbean Sea accounts for about 1/8 of total global tropical cyclone energy and frequency. However in 2010, the Atlantic saw 19 tropical storms, of which 12 became hurricanes as expected (and forecasted) due to the intense La Nina event and continued positive Atlantic Multidecadal Oscillation (AMO). The Atlantic Ocean's accumulated cyclone energy (ACE) corresponded to about 1/3 of the global calendar year output while the Western North Pacific typhoon season experienced a record few number. Seasonal forecasters of Atlantic hurricanes expect a similar but somewhat tempered outcome for the 2011 season, which has yet to get underway.
While the North Atlantic continued a 16-year period of above-normal activity in 2010, the North Pacific including the warm tropical waters from China to Mexico experienced the quietest tropical cyclone season in at least 40-years of historical records. Similarly, the most recent Southern Hemisphere cyclone season, except for the disastrous impacts of Yasi, was also notably below average. All told through June 27, 2011, overall global accumulated cyclone energy and frequency has settled into a period of record inactivity.

Last 4-decades of Global and Northern Hemisphere Accumulated Cyclone Energy: 24 month running sums through August 31, 2011. Note that the year indicated represents the value of ACE through the previous 24-months for the Northern Hemisphere (bottom line/gray boxes) and the entire global (top line/blue boxes). The area in between represents the Southern Hemisphere total ACE.
The author provides evidence demonstrating that considerable variability in tropical cyclone ACE is associated with the evolution of the character of observed large-scale climate mechanisms including the El Nino Southern Oscillation and Pacific Decadal Oscillation and in the Atlantic the Atlantic Multidecadal Oscillation or AMO. In contrast to record quiet North Pacific tropical cyclone activity in 2010, the North Atlantic basin remained very active by contributing almost one-third of the overall calendar year global ACE.
This year's Atlantic number of storms is high but ACE remains very low as only 3 hurricanes and 1 major. We have had a lot of 'shorties' this year that never would have been counted in earlier years (and in some cases should not have been counted this year).
Summary:
Tropical cyclone accumulated cyclone energy (ACE) has exhibited strikingly large global interannual variability during the past 40-years. In the pentad since 2006, Northern Hemisphere and global tropical cyclone ACE has decreased dramatically to the lowest levels since the late 1970s. Additionally, the frequency of tropical cyclones has reached a historical low. The frequency in all basins are shown to vary with multi-decadal ocean based oscillations.
Additional References:
NOAA wrote after the 2005 super hurricane season the following:
Tropical cyclone activity in the Atlantic basin has been above normal since 1995. This has been largely in response to the active phase of the multi-decadal signal (AMO). The average number of named storms since 1995 has been 13, compared to 8.6 during the preceding 25 years during which time the multi-decadal signal was in an inactive phase. An average of 7.7 hurricanes and 3.6 major hurricanes since 1995 compares to 5 hurricanes and 1.5 major hurricanes from 1970-1994.

Characteristics of an active multi-decadal signal in the Atlantic include: warmer SSTs in the tropical Atlantic region, an amplified sub-tropical ridge at upper levels across the central and eastern North Atlantic, reduced vertical wind shear in the deep tropics over the central North Atlantic, and an African Easterly Jet (AEJ) that is favorable for promoting the development and intensification of tropical disturbances moving westward off the coast of Africa. Recent studies also indicate that in addition to this multi-decadal oscillation the destructive power of hurricanes has generally increased since the mid-1970s, when the period of the most rapid increase in global ocean and land temperatures began.
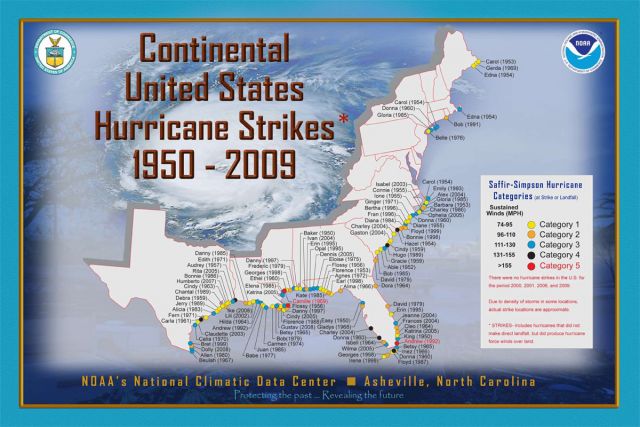
However, it is important to note that increased tropical cyclone activity does not necessarily translate into an increase in the number of landfalling tropical storms or hurricanes. Six of the past 11 years have had one or fewer landfalling hurricanes along the Gulf Coast, and there is no long-term trend in the number of landfalling hurricanes since 1900.
Here is a map of landfalling storms 1950 to 2010 (it is labelled 2009 but no landfalls in 2010). You can add dots in NC, NJ, NY for Irene and La for Lee for 2011.
Here is the return frequency in years for Major Hurricanes.
.jpg)
Return for all hurricanes.
.jpg)
-------------------------------------------------------------------------------------------------------------------------
The Amazing Decline in Deaths from Extreme Weather in an Era of Global Warming, 1900–2010
By Indur M. Goklany, US Department of Interior
Summary
Proponents of drastic curbs on greenhouse gas emissions claim that such emissions cause global warming and that this exacerbates the frequency and intensity of extreme weather events, including extreme heat, droughts, floods and storms such as hurricanes and cyclones. But what matters is not the incidence of extreme weather events per se but the impact of such events—especially the human impact. To that end, it is instructive to examine trends in global mortality (i.e. the number of people killed) and mortality rates (i.e. the proportion of people killed) associated with extreme weather events for the 111-year period from 1900 to 2010.

Aggregate mortality attributed to all extreme weather events globally has declined by more than 90% since the 1920s, in spite of a four-fold rise in population and much more complete reporting of such events. The aggregate mortality rate declined by 98%, largely due to decreased mortality in three main areas:
- Deaths and death rates from droughts, which were responsible for approximately 60% of cumulative deaths due to extreme weather events from 1900–2010, are more than 99.9% lower than in the 1920s.
- Deaths and death rates for floods, responsible for over 30% of cumulative extreme weather deaths, have declined by over 98% since the 1930s.
- Deaths and death rates for storms (i.e. hurricanes, cyclones, tornados, typhoons), responsible for around 7% of extreme weather deaths from 1900–2008, declined by more than 55% since the 1970s.
To put the public health impact of extreme weather events into context, cumulatively they now contribute only 0.07% to global mortality. Mortality from extreme weather events has declined even as all-cause mortality has increased, indicating that humanity is coping better with extreme weather events than it is with far more important health and safety problems.
The decreases in the numbers of deaths and death rates reflect a remarkable improvement in society’s adaptive capacity, likely due to greater wealth and better technology, enabled in part by use of hydrocarbon fuels. Imposing additional restrictions on the use of hydrocarbon fuels may slow the rate of improvement of this adaptive capacity and thereby worsen any negative impact of climate change. At the very least, the potential for such an adverse outcome should be weighed against any putative benefit arising from such restrictions.
The full study with diagrams is here, courtesy of the Reason Foundation. The press release, Extreme Weather Events Are Killing Fewer People Than Ever Before