Bastardi-Saurday Summary 14 years ago
February 11 12:13 PM
Not a good day. . the storm didn't work out enough and Garretts team dropped 2 games.
The complex storm along the East Coast has had its first part escape east with the combination of the lighter precip rates and temps just above freezing in most places, leading to an underachieving storm. I updated last night late and the arctic wave is over nw PA and cutting southeast with near blizzard conditions now developing right behind it. A close up of the map off the PSU e-wall site at noon:

The ob at Toronto is impressive as that 9 degree air means temps with wind and snow tonight will be in the single digits in western PA. The low will cut southeast to near the mouth of Delaware Bay tonight and the modeling is correctly catching the 150 mile wide swath of snow that will come with it, with rapid temp falls and strong winds.
The pattern is an active one and the next storm is right on its heels with snows in the areas outlined in the map I put out Thursday . The handoff of energy to the coastal system Wednesday will be something that will be tricky. While at this time heaviest snows as shown by 60 hour precip totals ending 00z Thurs are in the Mississippi Valley, this should hold together enough for some snow all the way to the Mid Atlantic coast. For now, the original map is okay.
Keep in mind at the the time that map was issued the forecast for PHL on the pt and click was PS and 50 Tuesday. For today, for when I first analyzed this storm, that did bring some snow it was chance of showers and in the mid and upper 40s. It's a bitter pill to swallow to have a system that I was getting bashed about as being non existent back on Monday fall short in spite of the map turning out the way it did. But that happens. And there is certainly risk in the upcoming pattern that what looks like a great pattern for storms and rumors of storms falls short.
First of all, in MJO land the phases 8 through 3 are the ones that produce the most widespread winter weather across the US.
.png)
All the models, WITH THE EXCEPTION OF THE US (WHY DOESNT THAT SURPRISE ME?), have the MJO taking a tour de force through the winter wonderland of phases 8, 1, 2, and then 3.
Euro
.gif)
Euro monthly
.gif)
JMAN
.gif)
UKMET
.gif)
but then there is the NCEP models
.gif)
As I said, I really don't believe this as it does not match with the physical realities of the pattern and all other modeling. The MJO has been the tutti di capo capi.. boss of all bosses this winter as in spite of the negative AO the last 2 weeks, it was in the warm phase for the US. The AO is actually closer to neutral or positive now, so it will be interesting to see if it works.
One of the big items I wanted to see, and did see, and because of it maintained the idea that winter would take a turn for the worse over here is what has happened in Europe. Notice the 500 mb hemispheric height anomaly for the winter through the 3rd week in Jan (even though we had 10 days of winter in the middle of the month)
The strong positive NAO and ridge into western and central Europe
But look at the last 2 weeks, the effects of the strat warm are now showing with more ridging over the poles and the trough into Europe
The pattern changed in Europe, now lets look at the CFSV2 weeklies the next 4 weeks:
week one
.png)
week two
.png)
week three (notice some ridging starting in Europe) but it's still a stormy pattern over the US
.png)
week 4 shows ridging starting over the US, but still some blocking, but there is a response to Europe
.png)
LETS BE CLEAR.. the Europe weather is not moving to the US, but the change in the pattern in Europe means other changes take place that force the pattern over the US to go to the trough you see (green) and with it the reason for the MJO phases in the foreign models to have validity.
Moral is the heart of winters worst is still in front of us, as this is a pattern of storms and rumors of storms.
Globally, the earths temperature continues down in a jagged fashion and is every bit as cold globally as the forecast made here back in May. This was done to demonstrate that the earths temp responds to large scale drivers, not CO2. In fact the more I examine the co2 argument the more absurd it seems. Given the atmosphere becomes less dense the higher up you go, and the specific gravity of CO2 is 1.5, air 1.0, and it heats and cools quicker than air, and only comprises .04 PERCENT of the air, it stands to reason that the increases we see can not be causing the warming, but instead are are manipulated by warming. CO2 can not mix efficiently with air, it tends to pool but its increase in higher levels would have to be because the earth is warming on its own, since a warming atmosphere would help keep a more dense object higher up in the atmosphere. However that cannot cause trapping since by its very nature, it would try to pool and concentrate, which is confirmed by NASA shots.
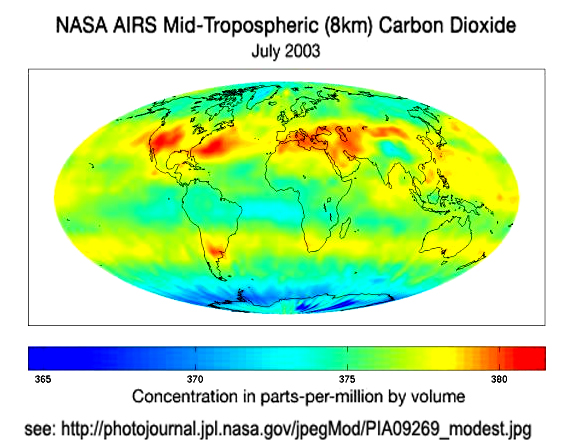
Notice this is not over the deep tropics for one and for two, explains well why we are seeing record cold at the so called IPCC trapping level, 400mb.. The fact is the Pacific cools, then the air above the boundary layer cools and then the low levels cool. That was my theory for predicting the winter global temp crash against the means WHICH IS NO PIECE OF BRILLIANCE BUT DEDUCTIVE REASONING BASED ON COMMON SENSE, something that warmingistas don't want you to use. If the theory was right, that the earths temps responds to the big natural driver, the PDO and the ENSO then cool the ENSO, you would then cool the air above the boundary layer and then the boundary layer (it is most sensitive to residual heat buildup).
Sure enough look at the graph since the PDO flipped to where it was last in the late 70s and more importantly the test case from last May, the crash of the global temp relative to averages this winter!
.png)
That being said, the US has been the warm heart of a cooling planet this winter.. the global temps since Jan 1 is -.191
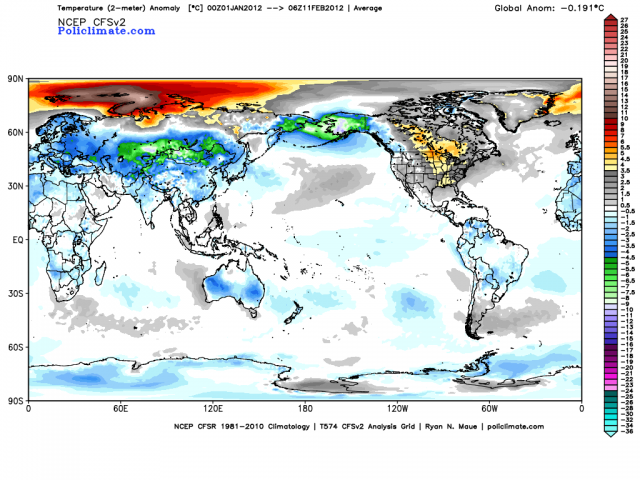
Keep in mind that temperature is a measure of energy and is not linear. Warm moist air has much more energy than cold dry air, and rises in the Arctic region are offset by falls in the tropical areas (ENSO, as in the la nina). While it might be true that averaged together temperatures could be a little warmer, the total energy picture does not change if there is cooling in the tropics. If one understands that for every 20 degrees you rise the wet bulb you double the buoyancy of the air, then you understand why a 1 degree fall where the wet bulb is 80 far outstrips the energy consideration of a 10 degree rise where the temp is -20. (as you ponder the warmth you see in the arctic, but the wicked cold further south in Asia.. thats because of blocking, but its all part of the natural process given the large scale parameters driving the entire system) Its why you can see temps vary so much on a clear calm cold night.. as opposed to a warm humid summer afternoon, when its tough to get the temp to rise 2 degrees but one can see temps bounce up and down by 10 degrees at sunrise when it's very cold. It takes much less energy to move a cold reading than warm. When you understand the nature of CO2, the nature of the air, and what temperature really means you understand why something like the triple crown of cooling I have out (natural cycles, solar cycles and the wild card, volcanoes) is far more likely to be driving the climate than a trace gas needed for life on the planet. And if you understand where we have been, and why, you have a better chance to know where we are going..
ciao for now