May Hurricane Season Update 7 years ago
May 7, 2018
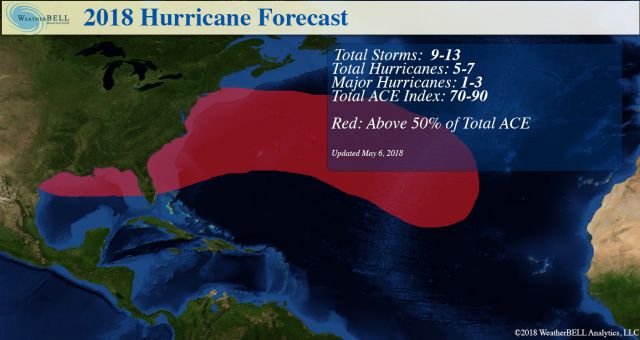
- New forecast lowers number of storms and total ACE.
- Keeps highest activity area the same.
- Forecasted Sea Level Pressure patterns harken back to "major hit drought" years 2006-2016.
- Very warm water in-close makes for challenges, though.
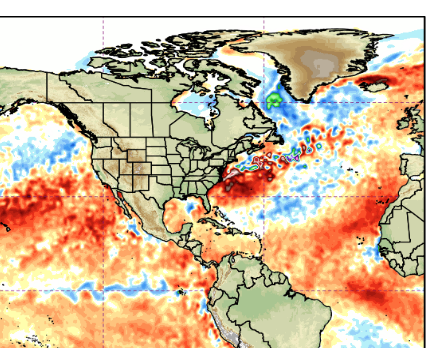
A cool ring in the Atlantic has developed:
The models have also continued to warm the ENSO areas during the hurricane season, and the combination of all this leads to an analog package that includes 2002, 2006, 2009 and 2014. The analogs, the new Euro idea and continuity from the last forecast have all come together to cause us to slightly reduce our previous forecast for total number of storm and ACE.
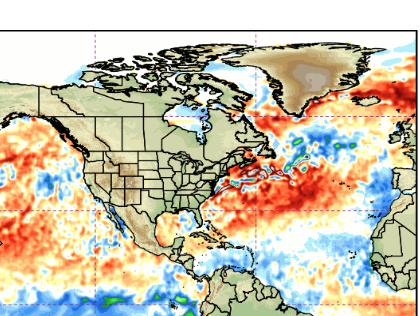
The blend of the analog years gives this for SSTs August-October:
.png)
Notice the El Niño coming on and a core of warm water off the East Coast. The Euro forecast in the Atlantic is actually more hostile for both SSTs and its pressure pattern in the Main Development Region. However, the forecasted higher pressures over northeastern Canada are actually a bullish signal for landfalling storms. My interpretation is that to the north of 25°N, development is going to be more prominent this year.
Countering the Euro is the analog Sea Level pressure pattern:

This has the kiss-of-death low pressure centered west to east to the north of the tropics, and looks much more like the hurricane hit drought years:
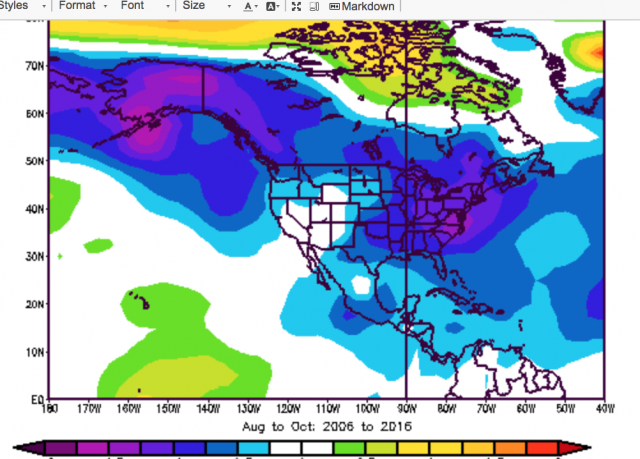
Last year had low pressure centered in the tropics, with a finger into the U.S.
.png)
Active U.S. hit seasons tend to have higher pressures in the Pacific and the Atlantic in the very area they are forecasted to be low this year.
That does not mean we dismiss this year as non-challenging! In 2002, Isidore and Lili set a record for two Category 4s in the Gulf of Mexico within 10 days. Isidore turned to the west-southwest into the Yucatan rather than the forecasted track, which as of the Saturday before had the storm turning to the west-northwest. This would have meant if the track forecast was right, a Category 3 or 4 would have been heading for the Texas Coast. The Yucatan hollowed the storm out and it never came back strongly, but it was a big enough feature so when Lili went through she fell apart from a Category 4 to what was actually a Category 1 at landfall (though it was called a Category 2), as the pressure rose over 30 mb in 12 hours. If both had carried out their potential it would have been only second to the Katrina-Rita double team in 2005.
In 2006 Ernesto could not avoid land, and so never cranked up in spite of Labor Day wind gusts to over 90 mph around the Tidewater while it was in its nonclassified state.
In 2009 Bill was as a major hurricane off the East Coast and then of course 2014 had Arthur on July 4 weekend. Note that Arthur was the strongest hurricane so early for the North Carolina coast. The El Niño evolved later in the year, but to show how the East Coast must stay on its toes, Bob in 1991 was in an El Niño year and beat Hurricane Carol's wind record at Block Island, no small feat. Belle in 1976 was in an El Niño year, too. All these developed in quite close to the coast.
Note on El Niño
I don't think it will be the kind of hyper El Niño year like 1969 or 2004. Every now and then that happens, but our forecast is in line with weaker Modoki-like El Niño evolutions. There is a vast difference in the look of the Main Development Region from last year, which was warm:
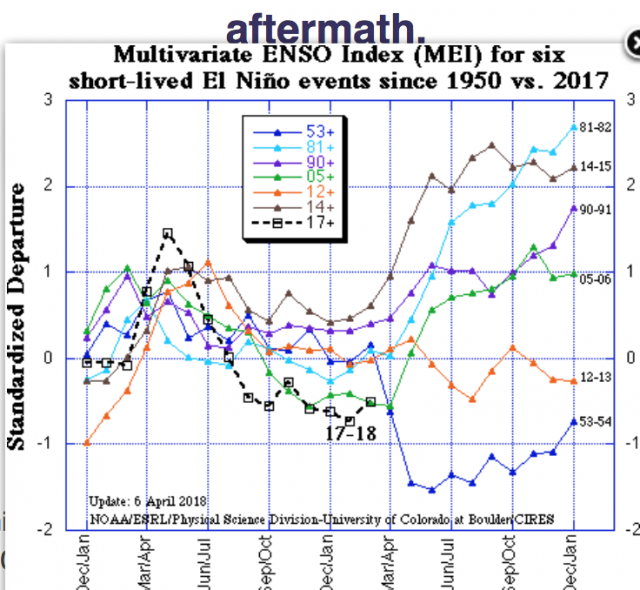
While bullish on the hits last year, I was way underdone on the ACE because of my belief an El Niño, that started in the MEI, would hold:
This year there has been a rapid drop of the SOI in the last three weeks:
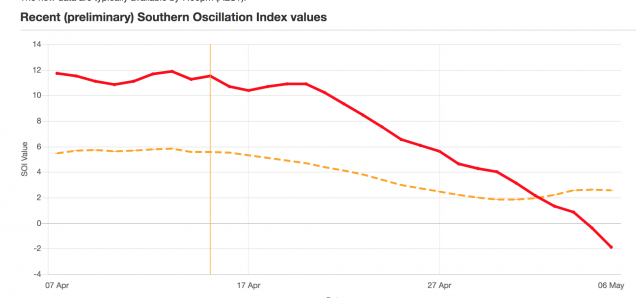
It is more or less what has happened around this time in the analog years noted. This year the rapid drop (more than 10 in a 30-day period) started April 13.
In 2002, it started a bit earlier:
.gif)
In 2006 it was April to May:
.gif)
2009 had a rapid fall this time of year:
.gif)
2014 had a double fall, one earlier in the year and one this time of year:
.gif)
The subsurface water is warm:
.png)
My confidence is high in the similar nature of these analog years, and it is supported to some degree by the Euro Sea Level Pressure pattern and to a larger degree with its SST forecast.
The Verdict
While much less active than last year as far total ACE, difficult storms are likely to develop near enough to the coast for big challenges. The water is very warm near the U.S. coast and the forecasted ECMWF pressure pattern, with high pressure over Canada like that, counters analogs that are back toward the hurricane hit drought years. High pressure over the Main Development Region should mean less long-track storms that are easy to see coming. Less of a season does not mean a non-season.
POWER AND IMPACT SCALE
There are two things I have been pushing over the years - our ideas on where to look for the highest ACE within the season and the Power and Impact Scale.
I believe that the scale I have developed, incorporating pressure and pressure tendency, is a much better indicator of the impact and total strength that a storm will have over a larger area than the Saffir-Simpson scale. Let's take Ike and Sandy. The scale uses the pressure categories 1-5 and the wind categories 1-5 on the Saffir-Simpson scale to come up with a total 1-10. A rapid deepening storm, more than 3/mb hour, gets an extra point tacked on, 1mb/hour a half point, and vice-versa for weakening. The physical reason for this is that a rapidly deepening storm is indicative of feedback mechanisms working so well that the storm is able to produce the maximum wind it's capable of. Conversely, if weakening rapidly, it's likely not to be able to bring that to the surface.
Ike at 953 mb was in the mid-range of Cat 3, "3.5" for pressure. Winds were reported at 110 mph, which is about 2.75 for wind. This made Ike on my scale a 6.25, which is a major hurricane. Gustav was about the same. Do you think for one second 75 years ago before all the categorizing we see now, those storms would not have been recorded as majors? More importantly, they did major damage. By the way, even though it might be technically true by way of the Saffir-Simpson scale, I believe it's not right to claim that the U.S. has not been hit by a major hurricane since 2005. Gustav, Ike and Sandy all were major impacting hurricanes and had the damage to prove it (though over a larger area). This is why the overall power of the storm in relation to other storms is approximated much better with my scale.
Sandy, at landfall, had a 946 mb pressure (verified by land observations at a barometer that was calibrated to within 0.5 mb several times when I was home at Somers Point, NJ), which is about a pressure of 3.75 on the Saffir-Simpson scale. Sandy was weakening off its peak several hours before, so the pressure is adjusted to 3.25. Winds were at 85 mph, which is a 1.5. Sandy goes down not as a Cat 1 hurricane but a combined 4.75, which is healthy Cat 2 (if we are going to chop it in half). This ranking certainly does it more justice.
While I am not holding my breath about this being adopted, I will from time to time reference it so we can have a better idea of the total picture of the storm. It's the old argument, the slugger (my power scale) or the boxer (the more "proper" Saffir-Simpson scale).