June 2021 Hurricane Season Forecast 4 years ago
June 6, 2021
- Another big year is on the way.
- We have changed the East Coast to be the highest target area relative to normal.
- There may be three predominant tracks this season.
- One each for the eastern and central Atlantic and the other in-close.
- Late feedback development will likely be a big forecast challenge again.
- There are no changes to the forecast numbers.
Named Storms: 16-22
Hurricanes: 9-13
Major Hurricanes: 3-6
ACE: 150-200
U.S. Landfalling Hurricanes: 3-6
U.S. Major Impact Landfalls: 2-4
U.S. Hurricane conditions: 4-8
.png)
The old forecast looked like this:
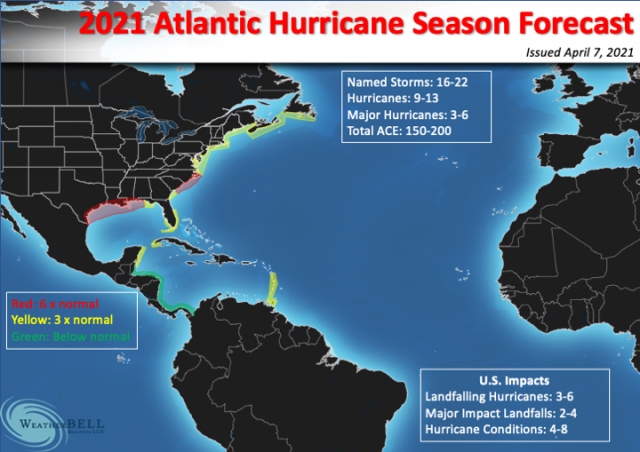
Note the increase in the Mid-Atlantic to southern New England. While the Gulf of Mexico should be above average, the emphasis may be centered more to the east this year.
The red areas represent a risk of more than 6 times the normal impact. Yellow is 3 times and green is below normal. For example, this means that if the average impact per year in an area is Saffir-Simpson 1.5 (all the years and see what the total rating is at landfall and divide by those years), then that area highlighted in red should get a total of 15. It can occur in multiple storms. Since this example would imply a total of 9, it means it is highly likely a major or two will hit there. Like using a normal snowfall and temperature to compute deviation from average, you must also look at the specific area, as those places to the northeast don't get hit as much as the Gulf Coast.
I will use last year as a quick and dirty example of what I am talking about. Let's take the western Gulf of Mexico outlined in the red from last year's impact forecast:
.png)
Talk about an advertisement for our ideas, look at the NOAA warning verification:
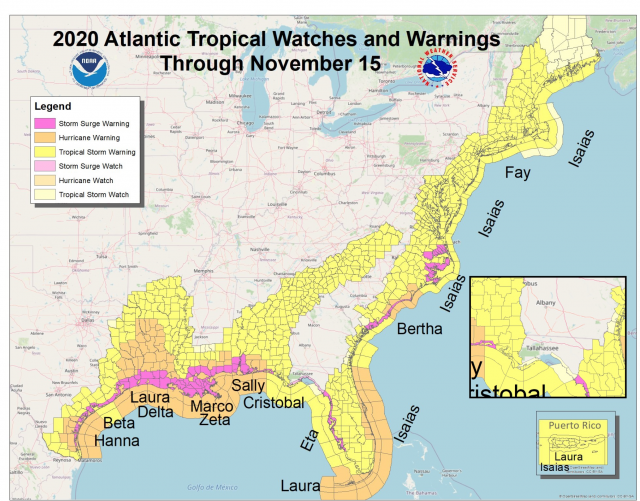
This was the activity in the western Gulf of Mexico last year:
Just in that area alone, there were 15 impact points in 2020. Over the years the estimate I came up with as an average (many years there are no hurricanes in here) is 1.5. Last year was 10 times that. So that is the metric I am trying to create to score this.
For the entire basin, I think that the overall storms will be relatively stronger than normal outside of the Main Development Region (MDR). The naming frenzy, combined with warm water farther to the north, will tend to pull the mean area to the north.
The numbers remain the same as the March issuance. This year we have added another category, hurricane conditions, as a storm can stay offshore and still blast someone with hurricane conditions. The definition of landfall is a single point, but storms are not single points. If you are in the eyewall for 12 hours, even if the storm stayed offshore (this has happened quite a lot around Cape Hatteras and can happen with a stalling storm that is paralleling the coast nearby), then you could be having hurricane impacts without a technical landfall. A great example of this, perhaps the best, was Saffir-Simpson Category 4 Helene in 1958, staying offshore but still causing major hurricane impacts on the North Carolina coast. That produced Cape Fear's strongest gust on record.
The change in June is with the Impact forecast. Though still above average, the central to the western Gulf of Mexico has been lowered a bit. Heavy rains and cooler SSTs there may be a sign of less activity, as we saw in the gentle giant season of 2010 when a lot of the energy was taken out of the atmosphere early. I will never forget talking with my father in August that year about if I was concerned about the early season rainfall, since I had a big year forecasted in the central Gulf Coast region. Such lessons remain.
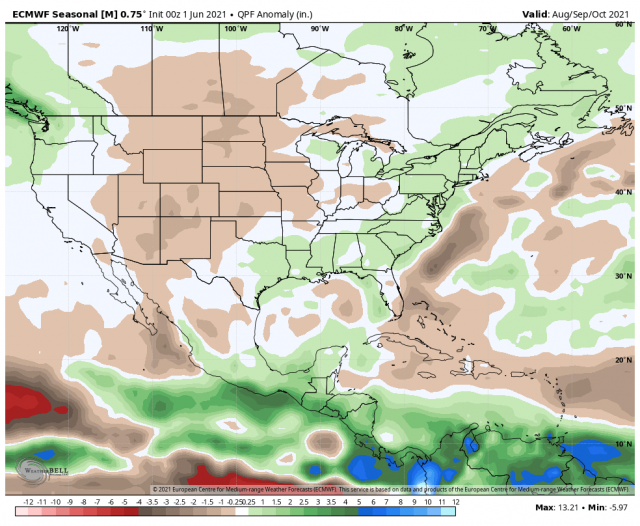
The Euro is going toward some of the suspicions I have been writing about, that it's the Carolinas to New England that may have the highest impact relative to averages. Included in that is the option for a storm to cut across via a shortcut from the southeast, rather than arcing up the coast, as a strong 500 mb ridge at the heart of the hurricane season is expected over the northwestern Atlantic.
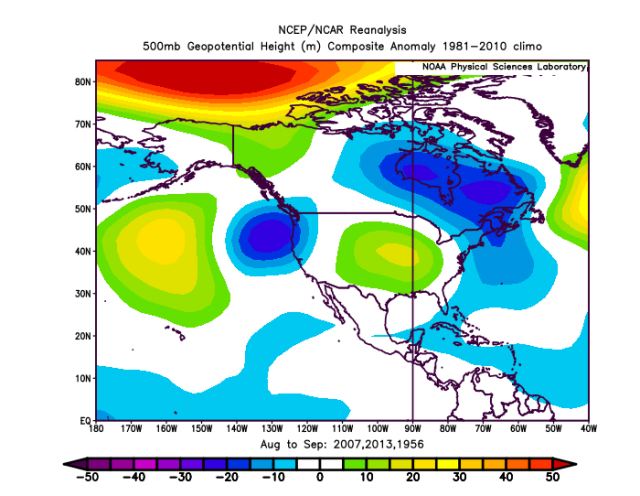
Now for the sake of argument, why would the season be less active, perhaps much less, than what I am portraying? There are seasons that looked like they should have been much bigger, like 1956, 2007, and 2013, which turned out to have much less activity. Just like this past winter looked more like an El Niño at times (despite a moderate La Niña) or the 1951-52 and 2018-19 winters turned out to be opposite of what the ENSO signal gave, you can have a period when there is a large-scale driver that is overwhelming the pattern. The total tropical activity (ACE) of those 3 years above was only around 67! I always make sure I look at what can go wrong. The problem is that though I have identified these before, I have had trouble beforehand in picking them out. So that's a concern here.
These are the 5-highest impact years in the current warm era:
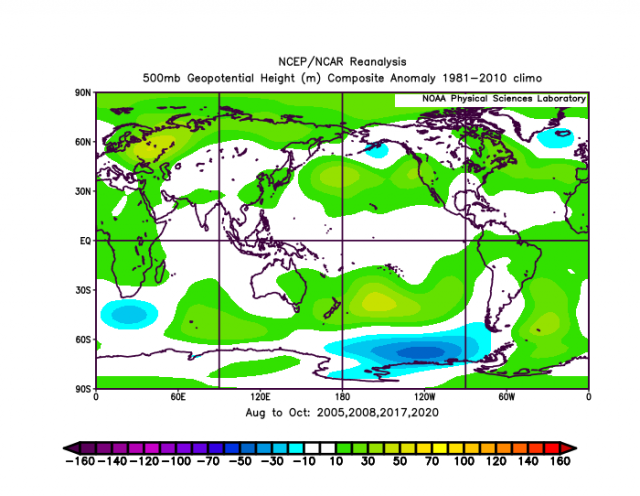
The Euro's 500 mb forecast from June 1 continues to show striking similarities to big impact years:
.png)
So right off the bat, the signature is there. The old-timers used to call the positives over the Maritimes the "Newfoundland wheel" because higher than average surface pressures are pulled northward and anything under it would be wheeled into the U.S.
A closeup view:
.png)
The non-years have the ridge over the Heartland and a trough in the opposite areas:
So that is the opposite of what is being forecasted here. Given the evolution of the spring pattern, I am pretty confident we are not going to see the inactive sample.
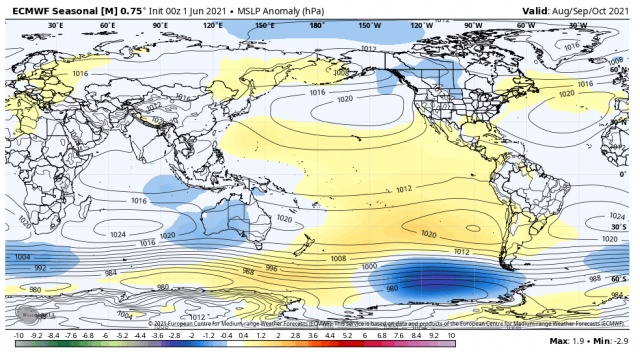
The surface pressure pattern forecast is conducive, with the positive over the northwestern Atlantic like that and what looks to be an alley opening for the East Coast.
A close up of North America:
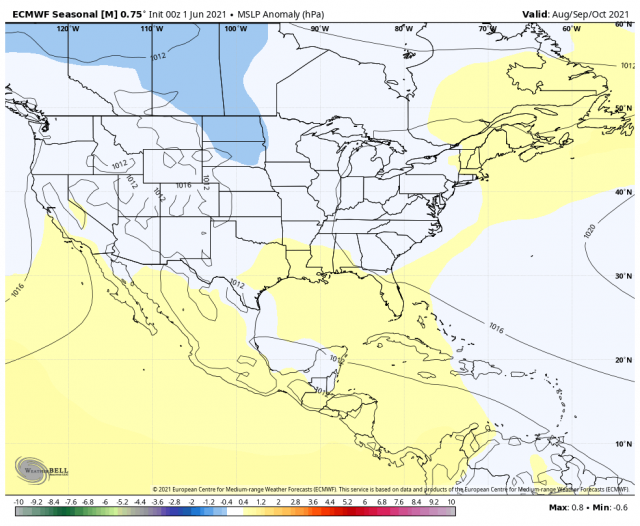
This would also support the Gulf of Mexico not being as active as we initially had, though the fact that the high impact year analogs still lean back there is why we still think activity will be above average there.
Another element that could slow the season down is that we will not be getting the "forecast gift" of the MJO this year. For those of you that read our forecasts last year, you don't know how many nights I thanked God for that change in the MJO regime we caught so that we could give everyone a heads up about the activity that we were going to see. I did not, nor have I seen, any writeup in previous years jump on the change in the MJO like that. In fact, it was the winter season debacle that actually helped me since when I figured that out and understood the opposite phases for cold were also the strongest hurricane hit correlations, it became clear.
So you cannot ignore the MJO. Phase 4 is the phase that correlates to high northwestern Gulf of Mexico activity.
.png)
By and large, the storms hit on the opposite side of the MJO hemisphere that we saw the MJO in during the prior winter.
January-March 2020 MJO:
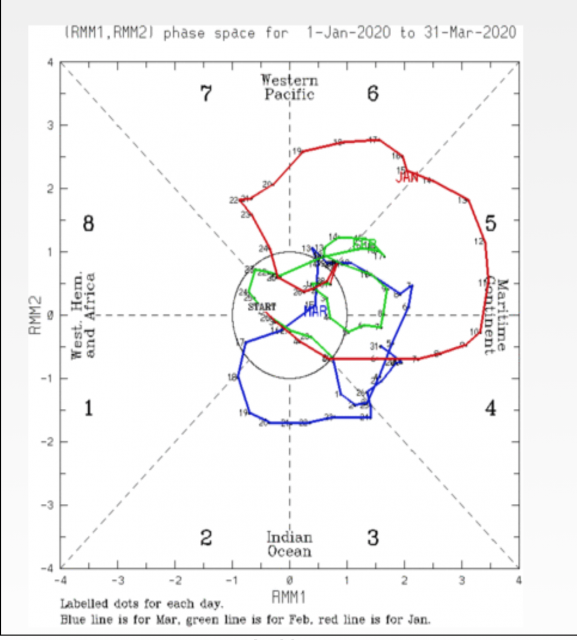
July-September 2020:
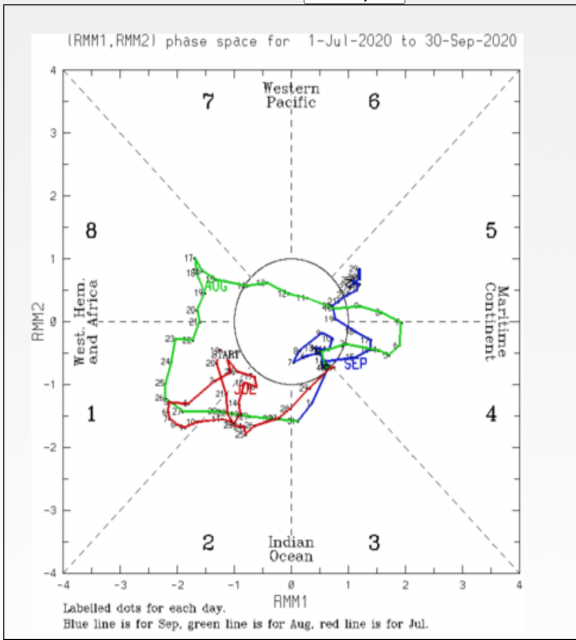
You can't get much more opposite.
So to catch a change in that major hemispheric driver meant it was going to hold in some form for several months. Not only do we not have that tool this year, but there is always a danger that pattern is still driving all this now because we are in a long-standing pattern that has been undetected. So the best I can do is try to line up the analog season tropical precipitation with the modeling ideas.
Of late the MJO has been tending to go opposite of last year, but I think that is because there are changes in the Pacific going on that will then level off and allow it to be weaker this year or in Phases 3 & 4. That is not etched in stone.
So you see there are two "negative" influences, but also in this section the countering strong model correlation to it being the opposite at 500 mb to those negative years.
European Model ACE forecast
This remains unchanged.
The average of the April European ACE forecasts over the past 5 years has averaged a bit over 70% of normal. Every one of those years they had below-normal activity. Its greatest blunder was 2017, where it had about 70% of normal. The average ACE of all these years was 175 or about 160% of the average ACE.
It appears ECMWF has bias-corrected the forecast a bit, so the forecast is no longer as startling as it once was. They are essentially weighing the last 5 years to come up with a more realistic forecast, though at some point it would be more confidence-inspiring if the physics was updated.
Global precipitation pattern
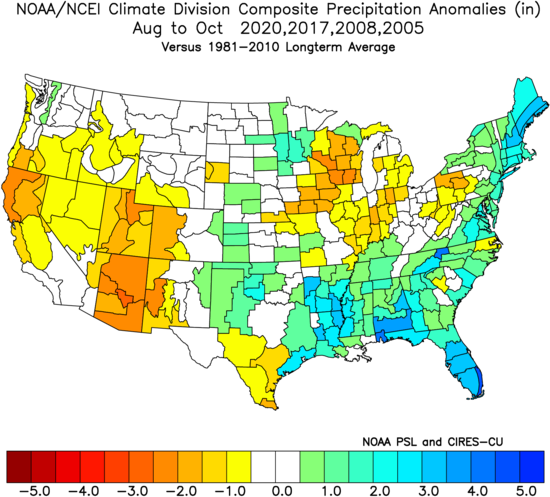
Here is the forecasted pattern for August-October:
.png)
That shows a lot of convection from the Indian Ocean eastward to Indonesia. This would line up with the JMA upward motion forecast for summer along with its precipitation forecast.
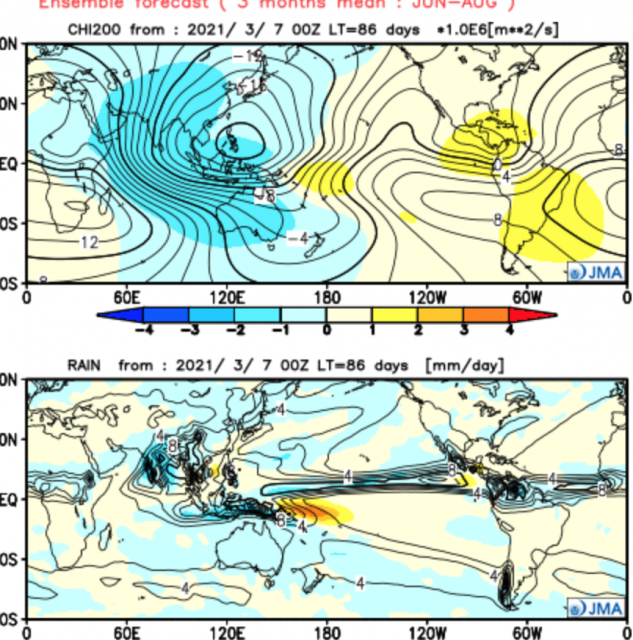
It is displaced a couple of months from the heart of the season, though. This lines up with the analog pattern over Indonesia into the eastern Indian Ocean, but also notice the drier western Indian Ocean in the analogs and the JMA showing sinking air over the Gulf of Mexico.
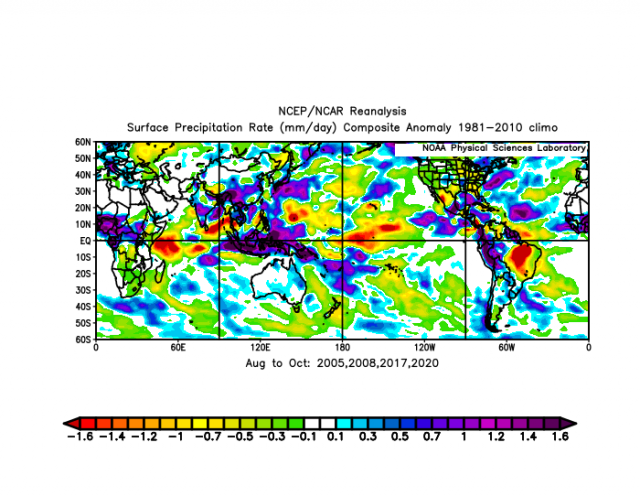
A closeup version of the rainfall pattern:
Now, remember what the signature of recurving hurricanes is - wind on the eastern side and rain to the west. While lowering the Gulf of Mexico impacts, we will still be above average there as the heavy precipitation implies. It looks like another year globally that the Western Hemisphere will be the impact grabber.
That is a very close match to the selected analog years of high impact in the current warmer era:
2020 saw a lot of late development. 2017 had Irma that was long-tracked but Harvey blew up in the western Gulf of Mexico. 2008 was a longer tracked year. 2005, while hitting off their peaks, Rita, Katrina, and Wilma all were stronger near 80°W than 60°W. Another year in there is 2011 with Lee and Irene.
Now one more look at the higher than average pressures on the East Coast and ask why it would be higher than average there. Averages might be lower or most storms like even the most active East Coast years will miss the East Coast. So it would only take one big one or a couple of smaller ones. The pattern over the northwestern Atlantic at 500 mb is a problem.
So a lot of recurves are expected but of the storms that are going to deepen, most will be in the last two days as they approach the coast. So it's a potential double nightmare. It's not magic, it's what the pattern dictates.
The May Trough
This certainly came true with a vengeance, as it was the sixth coldest May for the U.S. since 1980. Remember what is written below was written in early April, when I see forecasts moving along toward what is anticipated. So it does make me think we are on to something.
This theory is not mine. It was put in my head many years ago by a brilliant meteorologist I worked with who will remain nameless. That he saw this in a colder era boggles my mind, since it's when it's warmer like this that these tools typically appear more.
If May has a lot of cold air in North America, it indicates higher than average amplitude is likely to occur during the summer season. So there must be a balancing act. It's why you see so many big storms occurring to the east of where major cold is attacking. For those that have followed WeatherBell over the years, I have pointed out the numerous cases where cold air is showing up in advance of a storm. The reason is sort of intuitive. If there is enhanced surface pressure with cold over the U.S., then there should be enhanced convergence in the tropical waters near the U.S.
The month of May seeds this in two ways. First, it's indicative of future episodes of amplification during the warm season. Secondly, if there is a negative NAO it slows the easterlies down a bit and allows for more early-season convergence over the warmer waters. While that may not produce any tropical activity then, it does help with the buildup of moisture in the tropical playing field for later in the season.
These are observations, and there is no peer-reviewed research. It's just something I have used over the years and notice the correlations. So I am offering the reader an explanation. Before dismissing it, I would advise going forth to see what happens over a 30 to 40 year period. As I said, this warmer era is helping me see things that were tougher to see before.
So the kind of May I am expecting would also line up with the hurricane season idea. In fact, the analogs of those four hurricane seasons look like this for May:
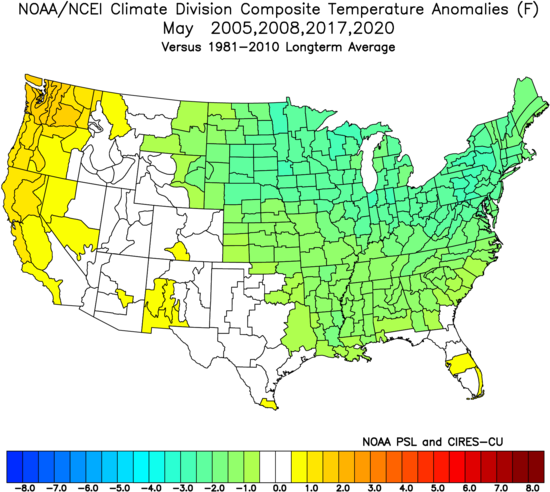
Here is what happened:
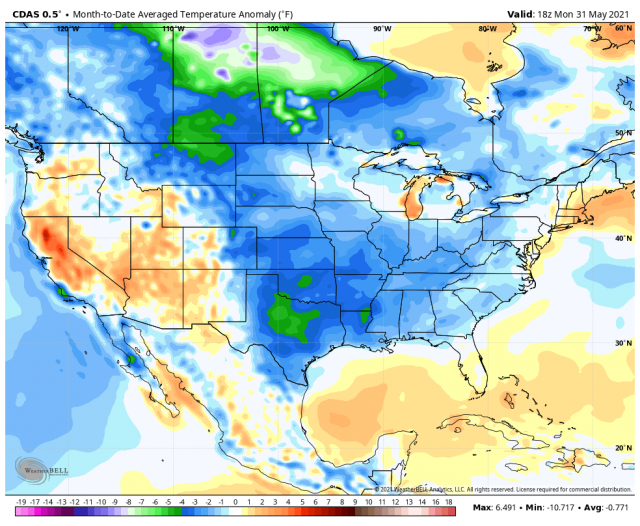
So it will be interesting to see if the correlation holds.
The Verdict
The big news is where we are forecasting the highest impacts, relative to average, is now from the Mid-Atlantic to New England. There is no change in the overall idea, just a homing-in. I still expect a June system in the Gulf of Mexico, but for the heart of the season, the coastal areas from the Carolinas to New England are the areas where I think the highest impacts will be. We had an alley into that area last year, it's just that the Gulf activity beat it. This year may be the opposite. Again that "short cut" type storm (like Hugo, Isabel, 1933 Virginia Beach, 1903 Atlantic City, and even a storm hitting New England moving to the west of due north) is on the table.
While there are some reasons for the season to be less than advertised, there are compelling similarities to some of the other major seasons this century to warrant concern. Our forecast again attempts to quantify the effect, not just list numbers of storms. In the past, I have made the point about dividing the Atlantic hurricane season into two areas, but since that is not going to be done our initial numbers are in the category of another major season again. Where we are different from the other sources out there is the subject of this missive - the impacts and where they are going to go.
Last year, depending on what scale you use, the impact number on the U.S. Coast was 18-20. This was a record on both the Saffir Simpson Scale and my Power & Impact scale. To put that in perspective, the 2005 season with three major hits and other lesser hits had fewer total impact points on the U.S. coast. Where they hit was obviously a huge key. If two major hurricanes hit near Cameron, Louisiana it is a far cry from two majors hitting New Orleans or the biggest Gulf Coast city, the Houston-Galveston area. There is nothing that says that cannot happen. In fact, you have to wonder why it has not.
With the new forecast, impacts farther to the north up the East Coast and in South Florida are expected to grab the most headlines. Keep in mind it takes fewer storms and weaker storms to produce above-average conditions in New England than it does for South Florida. I have no call for the Caribbean and the Bahamas due to the factors listed above, such as late development, a lot of tracks out to the northeast, and also a cluster to the south, which does put an enhanced area over the southeastern Caribbean.
The end game this year will not be like last year, which actually simply saw the areas where storms developed and hit move southward with time. This year I think Central America will get left alone overall, but that will be a call that I would have no problem updating if I see one coming for them.
With all these things in mind, when it's all said and done, back to back, this may exceed 2004 and 2005 and become the new benchmark for hurricane hits on the U.S.