August Hurricane Impact Forecast 3 years ago
August 7, 2022
- For the duration of the hurricane season, we are expecting the greatest impacts, relative to average, along the East Coast and Canada.
- The central Gulf Coast has near normal impacts forecasted, thanks to the heavy rain threat that has developed in the region.
- The western Gulf Coast is still vulnerable to above average impacts.
Named Storms: 14-18
Hurricanes: 7-10
Major Hurricanes: 3-5
ACE: 120-160
.png)
Interpretation of the Forecast
The red zones from Florida to Maine and in Atlantic Canada will have the highest impacts relative to the rule-of-thumb averages (I will develop a 30-year average next year). Some years you have a lot of impacts and some years you have none. Totaled up from Florida to New England, all the years average out to about one hurricane and one tropical storm per year, or a bit over Category 1. This year I am expecting multiple storms to impact this area and am estimating a total of about 8 "categories".
Why is the zone so big? Why did it change? This will be shown below as I am jumping on 1954 and 1996 as two analogs for the Tropical and Subtropical Atlantic. They were distinctive and much like this year. The Euro has its strongest threat to the Northeast in its entire archive, outdoing 2020. In fact, the August forecast in 2020 had a very high threat in the areas we had targeted that year and a lesser threat in the Northeast. So that really stoked my fire as far as thinking I could be on the right track. This year, the Euro has flipped its greatest departures into the northwestern Atlantic. That brings us to Atlantic Canada, where we are also expecting 6 times the average impacts, but the averages there are lower than the coast from Florida to Maine.
The orange zones are also vulnerable but to a lesser degree. The average impact per year on the Texas coast over the past 5 years has been a tad over Category 1. Harvey was a Category 4 but other storms only totaled up enough to make it a bit over 1. Over the 10-year period, it's even less. Relative to average, the Caribbean, Mexico, Central America, and the Bahamas all should have a similar impact as Texas.
The yellow area has a near-average risk thanks to both the recent rainfall and more rainfall that is forecasted during the heart of the season, suggesting a persistent trough coming down from the north.
When I am expecting a high-impact year like this I skew the scale toward way above, above, and normal. I hope you can recall the 2019 season when I took the opposite strategy. In 2019, which we forecasted as a below-average year, there was only a large area of below normal in the Caribbean. Dorian avoided that area if you remember, and it weakened coming to the East Coast after blasting the Bahamas. The last two years have had the hot colors, and so does this year because I am expecting a higher than average impact.
I think we will see a fast and furious period from mid and late August into early September, followed by a lull and then another active period. I don't have any below normal risk impact areas, though there certainly will be when the season is looked at retrospectively.
So why the changes? While I am still expecting an above-average year in terms of activity, I am not good enough to distinguish precisely the alley where the 3-5 storm threats will recurve. Will it be at 70°W? If so, there will be a lot of near misses for the East Coast. If it is back at 80°W, then Florida would be in the game, too.
The total U.S. impact is expected to be 12 Categories of the Power & Impact scale.
| Hurricane Season | P&I Total U.S. Impacts |
| 2017 | 10 |
| 2018 | 7 |
| 2019 | 3.5 |
| 2020 | 20 |
| 2021 | 7.5 |
| 2022 Forecast | 12 |
The Power and Impact totals are still a rough thumbnail, as I am not yet done creating 30-year means.
Forecast Discussion
If you go back and look, our impact forecasts have been pretty good and consistent over the past several years. This year, I have waffled on where the impacts will be but have always thought there would be above average impacts.
The changes reflect a few factors. Pattern-wise, this year is running close to the 1954 season, with a cold tail in the eastern Atlantic. 1954 (adjusted for new normals):
1996 is running a close second in that region:
.gif)
This year:
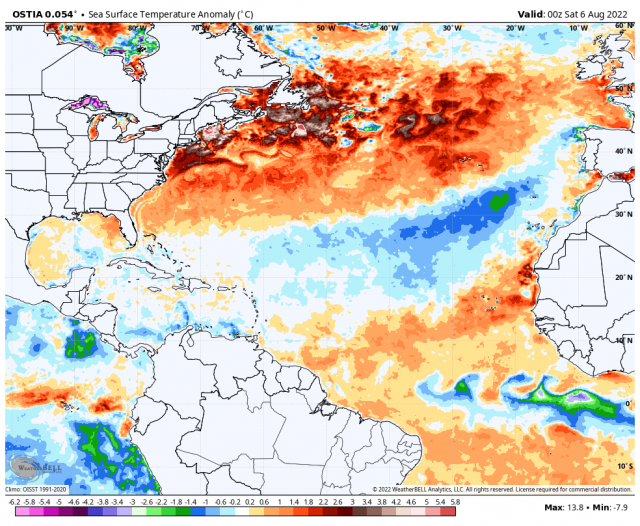
I am jumping on the tropical and subtropical temperatures. The warm waters in the North Atlantic this year are likely to be a factor in enhancing ridges. We had more of a northwesterly wind off the Northeast Coast in 1954 and 1996, cooling SSTs. Those years flipped to a warmer pattern later, but we have already flipped to a warmer pattern in 2022 in the Northeast with the second "heat wave" now occurring. We are also expecting a warm August-October period and even into November this year. The current dry conditions are likely to flip there, if not by hurricanes then by the natural process of what warm water does when cooler air masses start to fight against it as the seasons change.
The hurricane season of 1954:
.png)
1996:
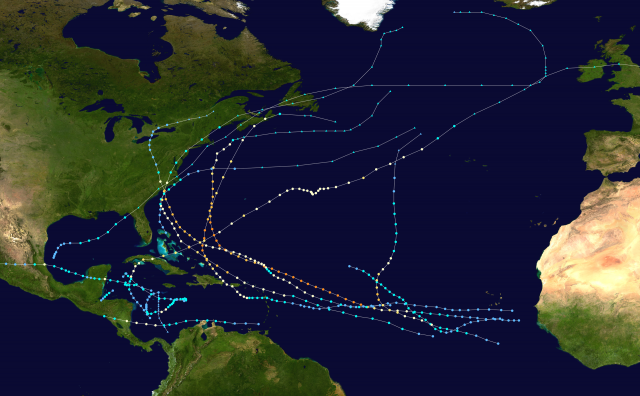
There are simply too many links to ignore with the tracks the way they were in the analogs.
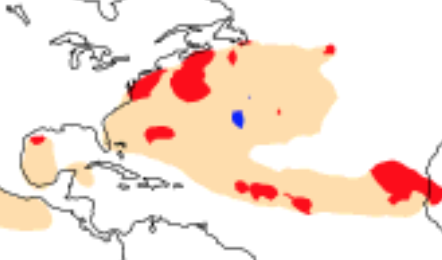
In addition, heavy rainfall has developed over the northern Gulf of Mexico in an area that we had targeted previously for the highest impacts. SSTs have cooled in the western Gulf of Mexico relative to average, and also to the southwest of Bermuda. While not getting too carried away, there is an alley between the two. The change in SSTs:
The distortion of the SST pattern:
The Euro 500 mb field for August to October has positives to the north of 35°N as it looks like warmer water is going to help with more than average ridging, which could help influence tracks.
.png)
The Euro's enhanced threat map chimes in with a worry about the western Atlantic:
This is by far the strongest threat on the August run of the model since 2017. The second strongest was 2020 with Faye and Isaias. The western Gulf of Mexico was really ramped up then versus this forecast (remember how it backed up our ideas?). In this case, I examined the SSTs and how close they are to 1954 and 1996, and so I feel there is a pretty good link.
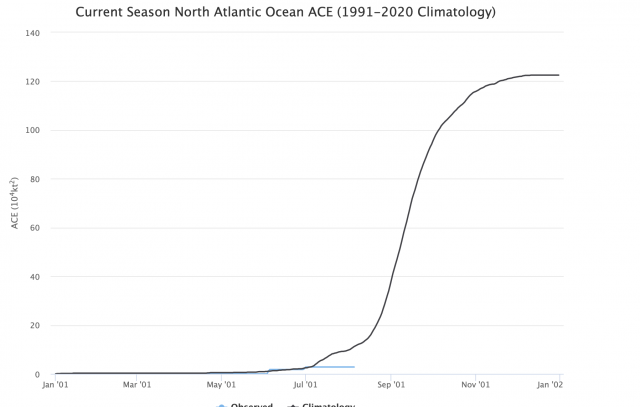
We may be in for a big track race from mid-August into mid-September. Note the natural ramp-up of activity this time of year:
Combine that with an MJO that looks like its heading for high correlated phases, and you have the potential for a hyperactive 30-day period:
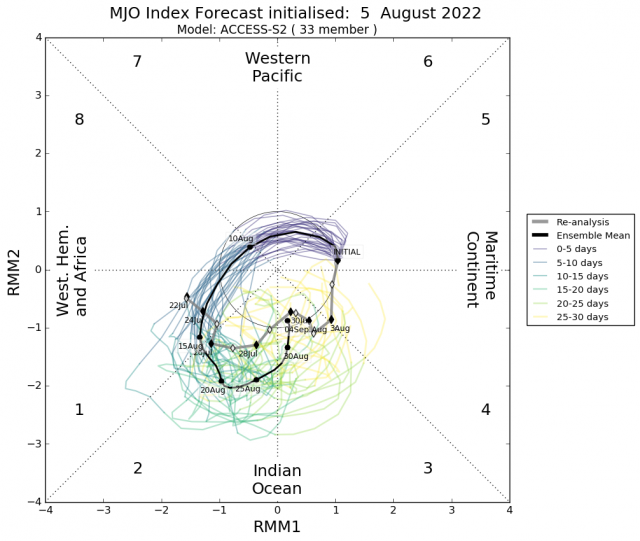
MJO correlation:
.png)
So this season may go from a sleepy start to above average activity in 2-3 weeks (as measured by ACE). There will likely be a mid-September slow down and then a rally in the last third of the season, which incidentally has been correlated with early attacks of winter (something we have been alluding to this year in our seasonal forecasts).
Another way of looking at this is to see what the patterns are like during "non-seasons". We know El Niños have a negative impact, and this year we have a third consecutive La Niña. It's also when the subtropical ridge is farther to the south when the most suppression takes place. In 2007 we had a non-El Niño season with not much going on over the eastern states.

If anything there has been a different look so far this year. The years of high impact:
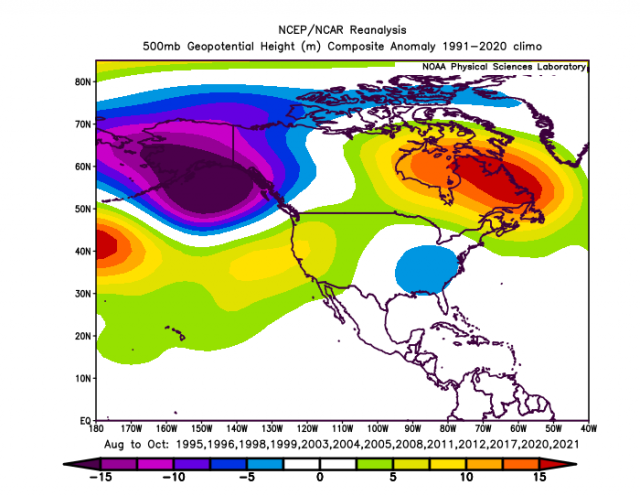
The positives are displaced to the north with the opening for the weakness in the ridge over the Southeast (where the hurricanes travel).
The Euro Seasonals look a lot like that:
.png)
The JMA is similar:
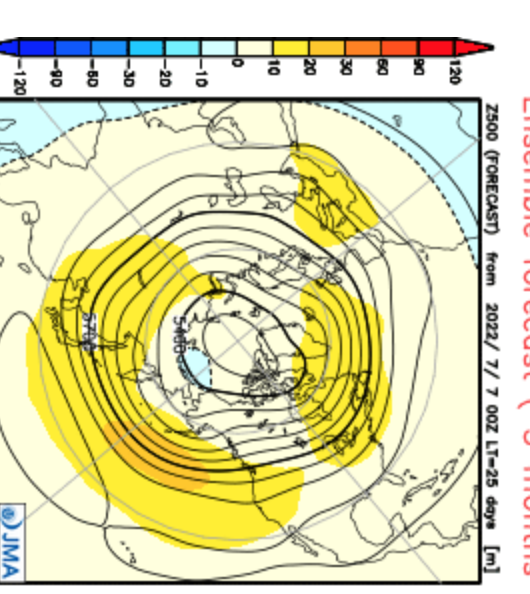
The Verdict
The biggest threat area was shifted to the east, while leaving room in the Gulf of Mexico, especially for Texas. Relative to average, it would be the East Coast and Canada leading the way, then Texas.
In the end, the total impact of a big season remains intact. I still think it's a matter of where (and not if) the significant impacts will occur. I had to move it more to the east than the last forecast from June because those two sore thumbs of 1996 and 1954 stuck out. With the objective guidance of the Euro and JMA agreeing with the analogs, I had to make a move before it was too late.
Obviously, each storm as it shows up has to be handled on its own without being tied down by pre-conceived notions. With a 31-year streak of no landfalling hurricanes on the Long Island or New England coasts after 8 storms in the prior 53 years, the alley near the East Coast appears to be something that has to be watched.
The heavy rainfall in the lower Mississippi Valley and cooling of the waters in the northern Gulf of Mexico is not something we had last year or the year before, so you should not expect the same result. That MJO rotation means a real track race may develop over the next few weeks. Of course, the Caribbean, Bahamas, Central America, and Mexico are always a concern even in weaker seasons and they remain so this year.