April Hurricane Impact Forecast 3 years ago
If you find this discussion valuable, email sales@weatherbell.com to ask about our daily tropical updates. In these updates released throughout the Atlantic hurricane season, our Chief Forecaster Joe Bastardi discusses current storm threats and tropical activity for the coming weeks and months.
You can also check out our full list of commercial services at this link here, including energy, agriculture, and winter services.
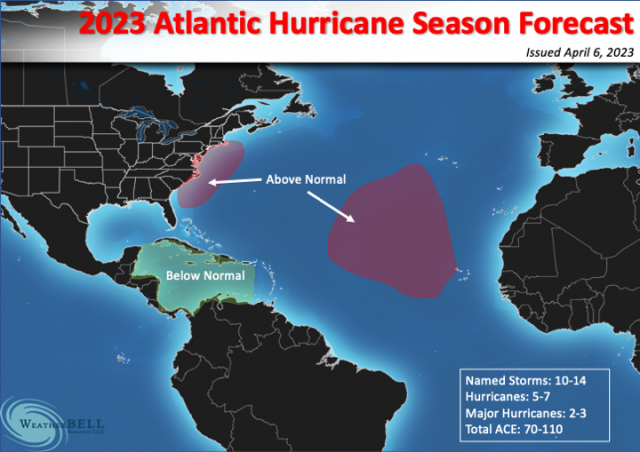
April 6, 2023
- The forecast numbers have been increased slightly from the February issuance.
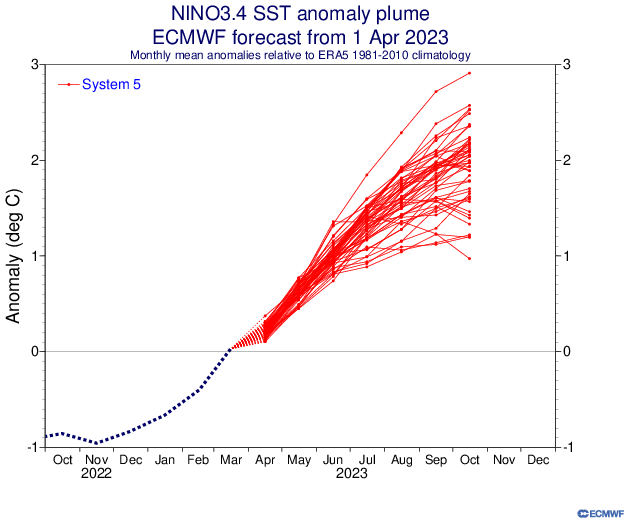
- El Niño will be a big influence, though whether it can overcome the warmth in the Atlantic is an open question.
Atlantic Basin
Named Storms: 10-14
Hurricanes: 5-7
Major Hurricanes: 2-3
ACE: 70-110
U.S. Expected impacts
Tropical storm conditions: 5
Hurricane conditions: 3
Major hurricane conditions: 1
Introduction
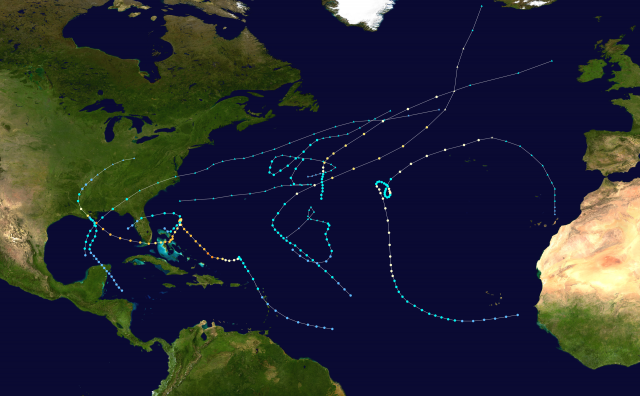
WeatherBell has been the pioneer in trying to alert the public as to where these storms are going to go. My long-standing idea is that numbers can be a red herring and even not valuable, as the biggest problem is where the storms wind up impacting. This year could be a classic example. It will feature a potentially top-10 El Niño versus a warm Atlantic. How much oxygen the El Niño can suck out of the room is not a normal slam dunk.
I am confident of a below average season for Central America and the Caribbean. A lot of the African wave energy may be left in the form of storms to the east of 50°W that recurve. The fear is a feeding frenzy near our coasts with in-close development. As long as the Atlantic is warm that will always be a concern, but an El Niño is no cause for relaxation.
We have taken the lead on creating a Power and Impact scale which is meant to quantify the overall power of storms better. This is done for two reasons. Firstly, the user will know more about the storm's nature. Secondly, it helps quantify a storm for historical comparisons. Donna, Charley, and Ian were all double-hitting Category 4s from Florida to the Carolinas, but in terms of Power and Impact, Donna was greater than Ian and much greater than Charley (as far as size). For a more detailed explanation, please visit https://www.weatherbell.com/power-and-impact-scale.
Forecast Discussion
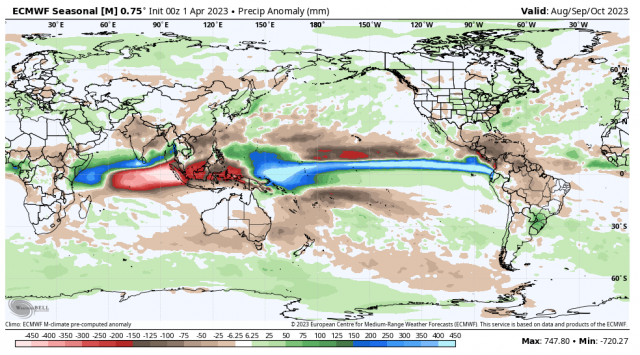
With the state of the oceans, we are in no-mans-land, awash in a sea of warmth. The widespread warmth distorts effects by spreading them out over a greater area. That will make this season a unique El Niño. El Niño is a part of this year's forecast and a big one, but in this case, its average effects may be mitigated. The Euro's tropical forecast is bizarre. It is above average in the Atlantic and East Pacific, but below normal in the West Pacific. The first and last forecast runs are completely opposite of what has happened in El Niños as strong as the model is forecasting.
Typically an El Niño is a slam-dunk-below-normal-activity forecast, by simply taking the blend of those events. There are two problems with that. First, the statistical models are not nearly as warm as the Euro and other dynamical models. They of course are based on statistics that incorporate years not as warm.
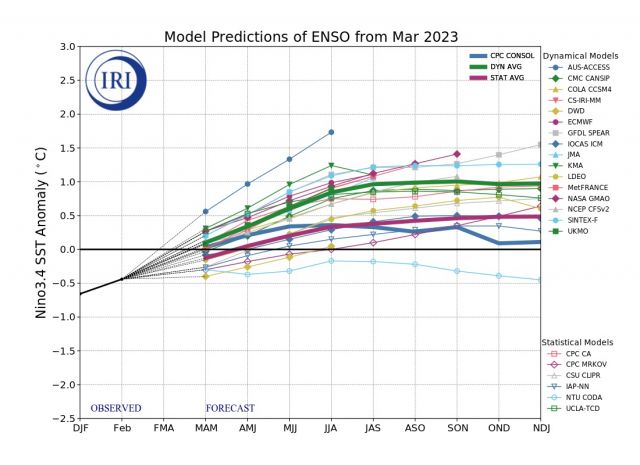
Obviously, a weaker El Niño means a different input. The aborted El Niño of 2017 is a prime example. Then again in 2017, the dynamical models were not off to the races:
.gif)

So now let's assume the models are right. The SSTs in those years looked like this:
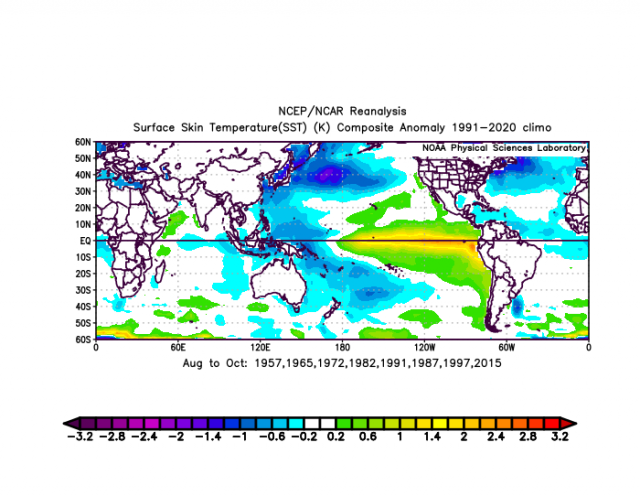
However, the Atlantic is much warmer this year:
.png)
I will discuss the implications below with comparisons for Sea Level Pressure and precipitation.
Now compare that to the active years in the Atlantic Basin:
.png)
So while we are going to use the analogs, we understand their use is limited this time around.
As I mentioned, the Euro forecast is strange. It has the West Pacific below normal and the East Pacific above, which is fine. However, it also has the Atlantic above normal. A look at the analog years reveals how bold that is.


.png)


.png)


.png)
Those years would give us a bit under 8 storms per year, 3-4 hurricanes, and 1 major hurricane per year. The average ACE Index is near 50! Those are way, way under what we have at the top. The Euro is forecasting 15 total storms and 6.5 hurricanes, with an ACE index of 120. I read that as a lot of little storms.
Now let's look at the precipitation patterns in the strong El Niño seasons:
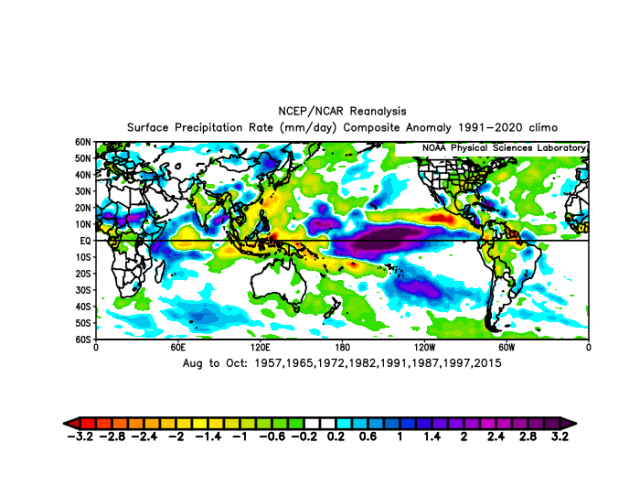
Here is the Euro for the heart of the hurricane season (ASO):
Active seasons:
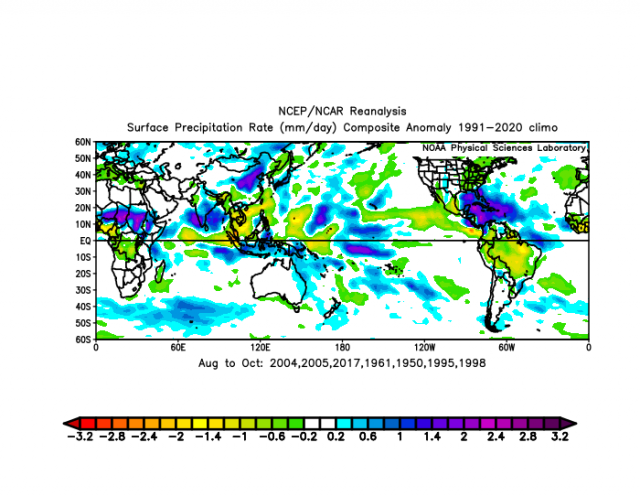
We see striking similarities in the southwestern Caribbean, but the Atlantic Basin is shown to be a bit wetter than the average El Niño year. Certainly, it is closer to that than the active years.
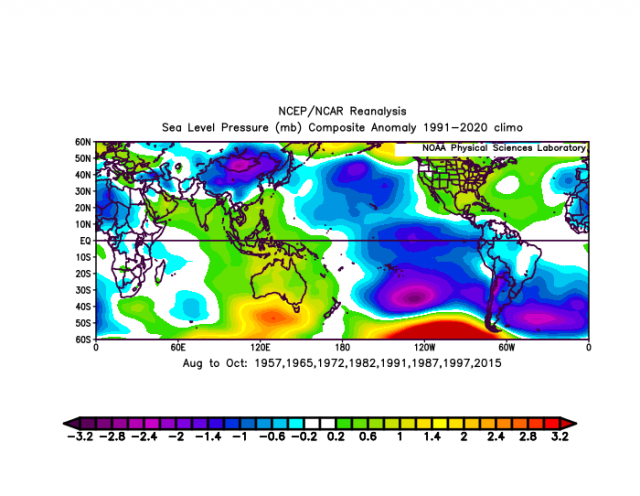
Sea Level Presure in stong El Niños:
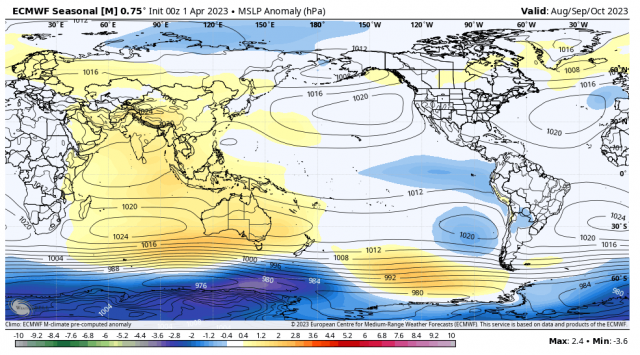
The Euro:
Active years:
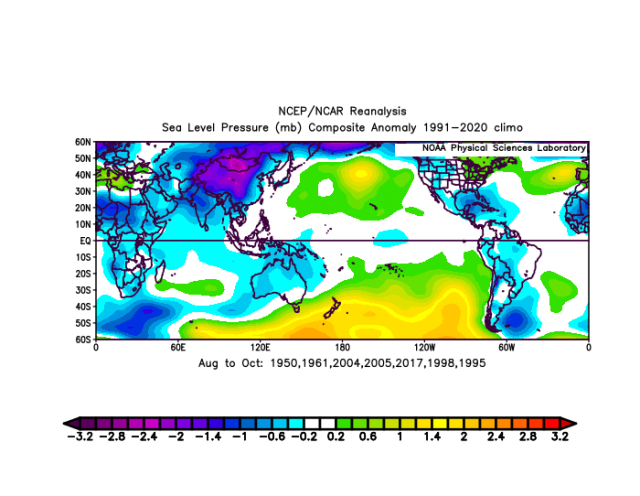
The trademark low pressure to the west of South America is there. This means stronger easterlies and wind sheer over the eastern Pacific. However, pressures over the Atlantic are shown to be near normal, which means the easterlies won't be as strong there. We don't get to where we are in the active years in the Atlantic Basin because of low pressure over the Gulf of Mexico and the Tropical Atlantic.
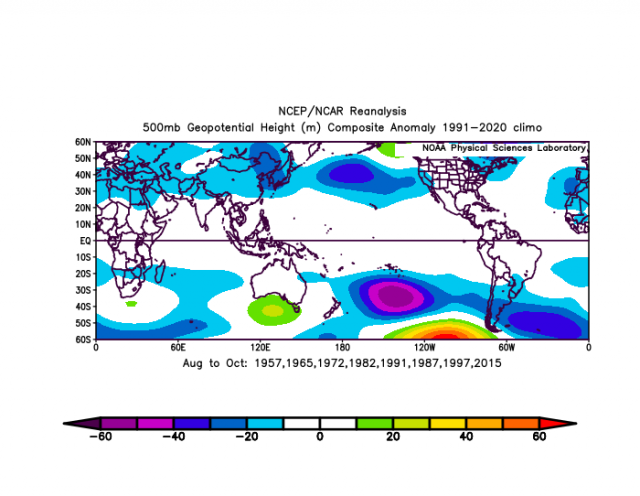
The 500 mb in El Niños:
The Euro:
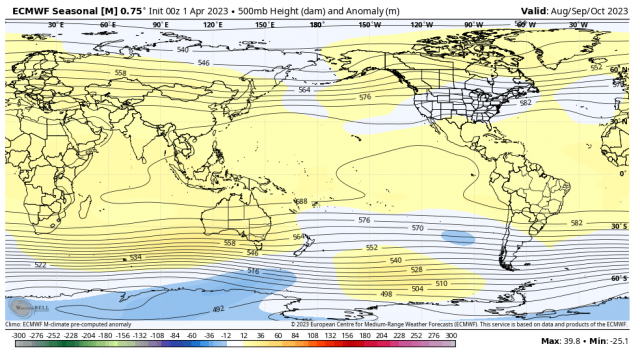
Active seasons:
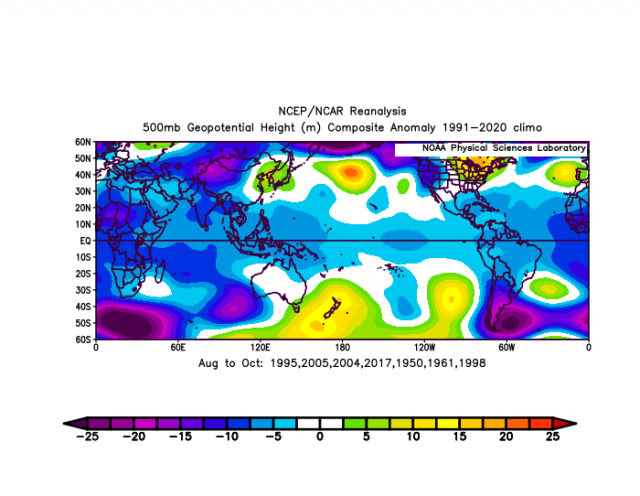
The Euro forecast is an antilog to the active seasons, though is not as far to the north. What is very strange is the positives all through Asia. That is the opposite of El Niño years.
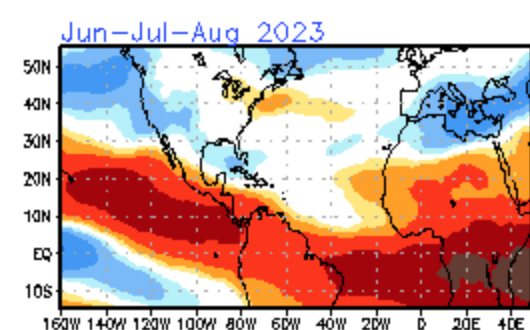
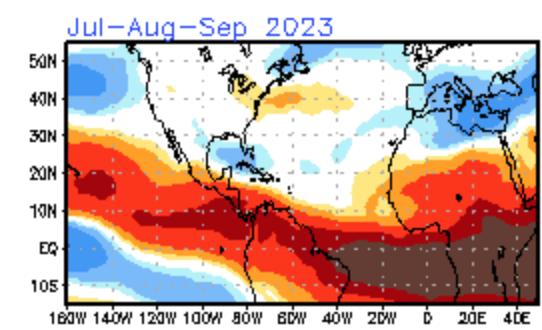
In addition, a look at the CFSv2 clearly shows a tendency for less shear around the Gulf of Mexico and Southeast, especially in the front part of the season. That means an early season storm or two can really get things started (1957 Audrey and 1972 Agnes for example).
JJA:
JAS:
ASO:
.png)
An active season like 2020 certainly has the opposite:
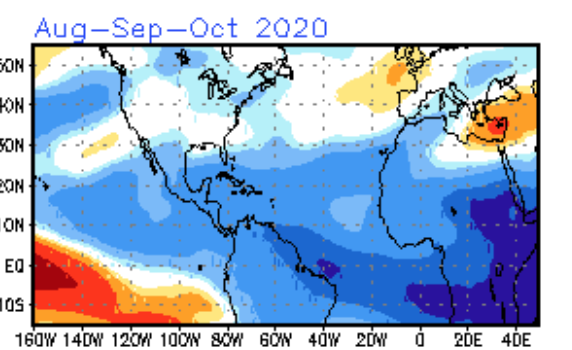
This year we do have less to the north of the "red zone" that stands out so clearly in non-active years. Keep in mind this is the most active season on record, but the point is around the Gulf of Mexico and Florida there was less hostility.
West Pacific forecast
We have had a 3-year period of very low typhoon activity (and landfalling activity). That should come to an end. The Euro likes the landfalls but with less than average ACE, which is baffling to me. For East Asian interests, the trend should be over. For climate interests, if you don't get an ACE bounceback to well above in this pattern, then I think the screaming and yelling about the tropics has got to stop. It becomes absurd. ACE Index is not increasing, for one, but the shutdown of the West Pacific over the last 3 years with no major above normal activity to counter it with this kind of El Niño would really be a nail in that coffin. I do think we will have some major landfalling typhoons this year, though, more so than in the last 3 years.
The Verdict
I hope I have laid out the parameters here in a way you can understand what we are looking at. I have written about the weakening of the Hadley Cell and dropping 400 mb humidities over the Main Development Regions of the world, a distortion of the pattern due to major warming away from the Tropics likely has a role in that. This year for the Atlantic Basin we will have an El Niño that I think can get to +1.5°C (the CFSv2, Canadian, and Euro are all at +2°C) but it is surrounded by global SSTs that are so warm that we have not seen anything like it, let alone an El Niño year. So modeling is trying to handle inputs that it may not be able to.
My take is that the Atlantic is warm enough that the farther away from the Main Development Region the more the chance for development relative to normal. That means the U.S. is in an area close to it.