2013 Hurricane Season Forecast 12 years ago
March 30, 2013
A wild season is on the way, and the "major hit drought" on the US coast should end. In fact, multiple major hits are likely this year with the cold PDO, warm AMO decadal signal favoring the East Coast, as in the 1950s.
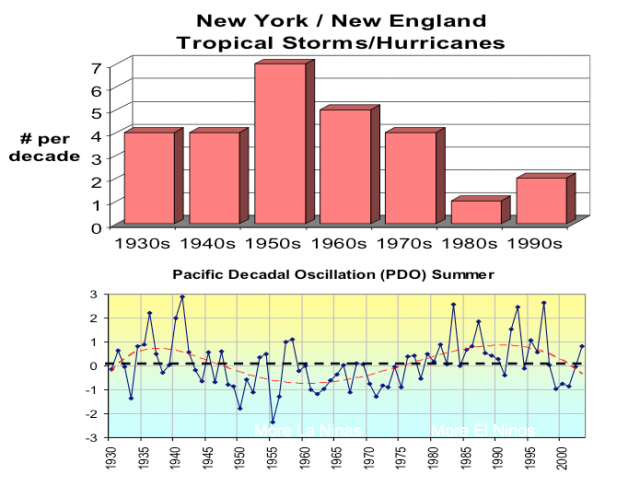
Having a cold PDO and warm AMO is a natural US landfall hit problem, as it changes the overall interaction between the tropics and temperate regions, so the western Atlantic basin is favored for activity relative to averages. The PDO Is now cold. This only goes out to 2007, but we can see how the last cold cycle of the PDO while the AMO was warm in the 1950s had ramped up East Coast activity.
Playing into all this is a disturbing linkage between the 400 mb pattern and Sea Surface Temperatures (SST) in March and some of the mega seasons we have dealt with. The playing field is very different from last year with the cold March at 400 mb.
Last year:
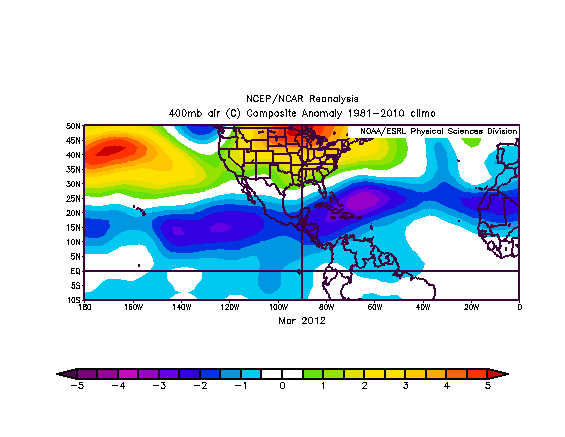
This year:
This is in line with my top 5 selected seasons (2004, 2005, 1964, 2010, 1969) based on the 400 mb pattern and ocean temperatures in March.
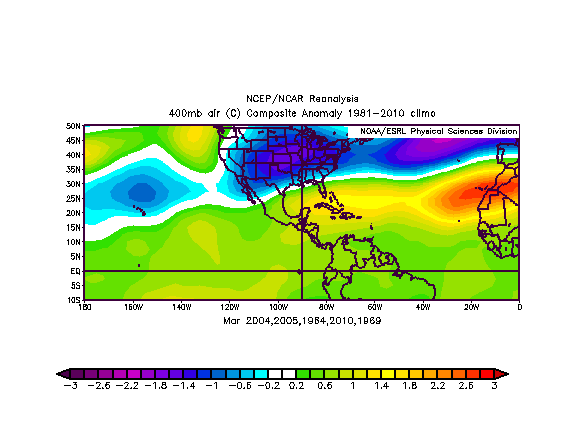
The SST in those years:
.png)
The SST this year:
I came up with these years by going through each of the top ACE years after looking at lower ACE years and seeing little that were this close. There are high ACE years that did not match, but the years outlined gave the amazing closeness that you see to this year as of March!
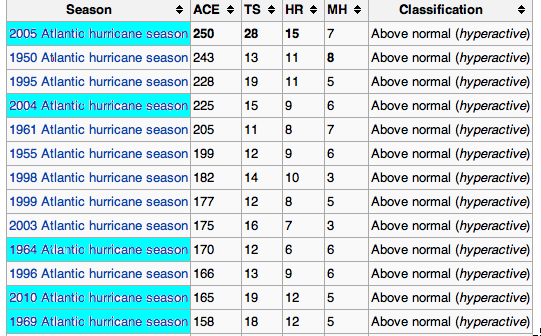
There are some interesting years in here as the tropical Pacific was warm in 2005, 2004 and 1969 (the latter two El Nino years), which as I pointed out last year showed the value in the 400 mb level test, as the El Nino could not hold down the ACE! Remember this method is for the deep tropics, south of 22.5 North.
The moral is this will be a much more dangerous season for the Caribbean, and likely the southeast US. The decadal signal argues for activity up the East Coast, while the Gulf and the further west one goes is more of a chance. Nowhere would I have activity less than normal, and this year the ACE will be the combination of these years averaged with the average since the AMO flipped (1995). This averaged ACE figure is 126. The average of the analog years is 195. The average of the two is a hyperactive ACE forecast of 165. From this figure, we look for a total of 16 storms, with 5 majors, 7 category 1 or 2, and 4 tropical storms.
Last year, Dr. Maue suggested blending in the ACE in warm AMO since 1995 and if I had, it would have limited the ACE error, which came in 3 storms in the Atlantic north of 25 North, including the eyesore near the Azores, Nadine. Dr. Maue's suggestion would have pulled UP the ACE from the analog I used. This year, Dr Maue's suggestion is factored in, but pulls DOWN the ACE! The top 5 analog seasons give us an ACE of 195 or so. I am using the combination of both and upping it a bit from the mid point of 160 to 165 to adjust for what I see as a bias toward keeping storms longer and stronger in areas that are using satellite coverage. It is a big year, no matter what.
I am not going to play games with numbers, as the ACE will be calculated from a specific outlined area that I will show in the map, as we are getting named cyclones that are never verified in the middle of nowhere, or storms that last for less than a 3 day forecast period. So, we are not really interested in the game in the middle of nowhere, and the map will define what I will look at relative to the established history of hurricanes before the naming frenzy that is occurring. You will see below where I think the bulk of the action will occur, and eyesores near the Azores are not that big a deal. I find that most practicing meteorologists are very much in my camp on this.
I have long advocated two Atlantic naming areas so we can have a way to accurately measure seasons against the past, and to eliminate what has become a political problem with people using hurricanes as evidence of climate change. I want to avoid that argument, and I will look at the areas that have merit, as far as established history (and in reality, what matters to us, storms that are relatively close to the areas we are concerned about).
This year will be much different from last year with ramped up activity in the classic tropical long-tracked breeding areas. The Gulf loop current is alive and well, and warm water near the East Coast spells trouble there. The map contains a cone that comes from the tropics toward the US.
2013 Hurricane Season
.jpg)
There are no areas where I can say below normal activity is expected.
The arc of highest threat is based on the pattern similarities to 2004/05, and the decadal threat of the 1950s. The loop current is alive and well in the eastern Gulf right now and the AMO is in classic hurricane mode. The warm 400 mb level is OPPOSITE last year. Unlike last year when I could take a stand on saying the deep tropical activity will be well below normal, there are no areas I can identify this year as being below normal. I do not expect quite the spray of 2005 west because of the decadal threat being further east, but this is by no means taking a stand on Texas against hurricanes. It is taking an early stand on the magnitude of the season I see coming on and based on the research, where we would have to look for the most mayhem.
I am calling it as I see it and I think this season has bad intentions. Unless someone can show me a strong El Nino coming on, the 1969/2004 seasons show how a weaker one doesn't matter when you are lined up with warm water and a warm atmosphere at the start.
May will be crucial! A negative NAO would seal the deal (a reason for an active tornado season, by the way) and it doesn't have to be cold when we have negative NAOs deeper in the season, but a cooler May is another signal. In any case, this is where we stand now.
The Power and impact scale
Power:
This is a scale from 1-10, rather than 1 to 5, that incorporates the pressure and wind speed, along with an adjustment based on the storm's pressure tendency. An Intensifying storm is more likely to have the structure that can quickly and efficiently bring the west strong winds in the lower part of the storm to the surface. Conversely, a weakening storm is one where the strongest winds are probably not reaching the surface. An example of the former would be Andrew as it reached south Florida, and an example of the latter would be Floyd as it reached the Carolinas. Under our scale, a storm like Ike was plainly a major hurricane. As if we rate this 1 to 10, the pressure of Ike at 950 mb would have given the storm a pressure contribution of category 3.6 while the reported wind of 105mph was at 2.75. It is not that the WIND needs to be adjusted for the category, it is the understanding of what the pressure means in the western hemisphere as far as the overall energy of the storm that has to be adjusted. This scale means that if we know the storm has a power rating of 6, either the energy is spread out a bit so that if it does bundle we can expect the greater damage (eye wall tightening, or the large area of stronger winds though not as intense at the center over water causing a greater piling up of water over a larger area) as in a major hurricane. If Ike were deepening, the storm would be given an extra 0.5, if weakening we subtract 0.5. In any case, it’s a classic example of why describing the overall power of the storm can help prepare one more than just focusing on the one minute wind speed at the center.
Impact:
Based on the above scale, storms are rated from 1 to 100, where the perfect storm is close to 100, while the weakest depression is a 1. This is used to make forecasts for the US and western hemisphere impact forecast that we do, but can also be used for smaller areas. For Instance, suppose you wish to know what impact this year will be for the Gulf, east of 90 West. We would take our analog package and then give you a figure, and relate it to recent years. We will use 2008 as the example, since it is one of the analog years. The point here is that we have to “spread” this scale out, and in reality, it is probably not spread out enough but will drive home the point about “bang for the buck.” A storm like Ike had a landfall impact rating of close to 65. It is similar to Isabel in 2003, for instance. But a storm like Andrew with a category 4.75 pressure and category 5 winds would be close to 100 (Camille, Labor Day 1935, etc. are in there too).
The Big Worry:
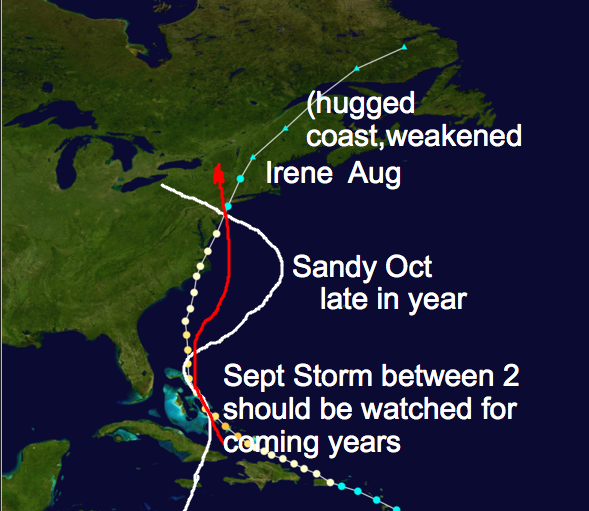
When one studies tracks and understands the cycle we are in (tracks of major hurricaness up the East Coast in the 1950s, for instance),
.jpg)
you understand that 10 years from now Sandy and Irene may be looked at as precursors to what was going to happen in this cycle. I want you to look at this. It shows what may, in reality, be expected. Irene hugged the coast, so she weakened. Sandy was late in the season, off peak, warmth of the water. What happens if a storm has a mid ground track at the height of the season?
Why not? Look at September 1903!
.png)
Look at the end game track!
Or, shift the 1938 storm 100 miles west:
.png)
In fact, what I drew (the in-between storm) is 1938, shifted a little west. How anyone can rationally blame CO2 for these storms? If you simply look at what has happened, that is beyond comprehension to me. Or what if we got the 1947 track and the intensity of Katrina or Camille?
.png)
That is 25 feet, not 9 feet, of water back into Lake Pontchartrain. Can any rational person look at these facts and not understand that what happens is nature? In fact, the question should be Why haven't these storms happened? The answer is that there is an entire set of storms that is not yet complete. This has been with us since the earth evolved to the way it is now and will continue. These storms will happen, as the set will be completed, as nature intended.
In the grand scheme of it all, we are in a heightened time, but you can see the method behind my madness. Sad to say, it takes a lot of time and research, but nothing more than that and common sense as well as a knowledge of what occurred in the past. There is no magic, no great equation, no discovery of what is not already there, always been there, and always will be: the weather.