WeatherBELL Analytics 2012 Hurricane Season Forecast 14 years ago
The 2012 Atlantic Hurricane Season is likely to see an overall decrease in tropical activity as compared to last year, but with the focus of tropical development closer to the United States.
When evaluating the hurricane season as a whole, it is important to consider more data than just the number of storms that are named. The best way to determine total seasonal activity is by collectively measuring the intensity and duration of named tropical cyclones (both tropical storms and hurricanes) during a given season. The most common evaluation is represented by the ACE Index, which is a single number that represents the Accumulated Cyclone Energy. The ACE Index is a calculation dependent on maximum sustained surface wind speeds in named storms of at least tropical storm strength. We often combine the ACE Index with the total number of named storms to categorize the hurricane season in relation to normal.
ACE Index values in relation to normal are as follows:
Above-Normal Season: ACE value above 103
Near-Normal Season: ACE value between 66 and 103
Below-Normal Season: ACE value below 66
The total number of storms and the ACE Index in the Atlantic are expected to be down for the 2012 Atlantic Hurricane Season. However, the potential for damage from land falling storms is high. This is because the pattern is such that development of over 50% of the storms may be within 300 miles of the US coast.
Long tracked storms that turn out to sea, as we saw last year (with the exception of Irene), are not anticipated this year. Instead, storms that develop close to the coast are expected, which may reach maximum intensity as they reach shore. This would mean a tougher forecast year, in spite of fewer storms than the past couple of years.
While detailed ideas are on the WeatherBELL Premium and WeatherBELL Commercial websites, the map summary below visually represents the full forecast.
.jpg)
The earlier part of the season, June-August, may favor development near and just off the Southeast coast. Storms such as Belle (1976) or Bob (1991) come to mind in this case.
During the mid and latter part of the season, the Gulf may be at a higher risk from the African waves that can make it across the Atlantic and develop late. One of the analog years is 2002, which is the year of Isidore and Lili.
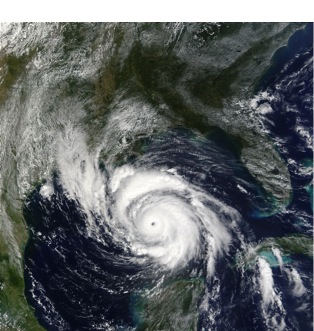
Hurricane Lili, 2002
Credit: Jacques Descloitres, MODIS Land Rapid Response Team, NASA/GSFC
While forecasted numbers are lower this year, years such as 1965 with Betsy, 1983 with Alicia, and 1992 with Andrew also had lower numbers. In addition, a weak El Nino is expected to develop this year.
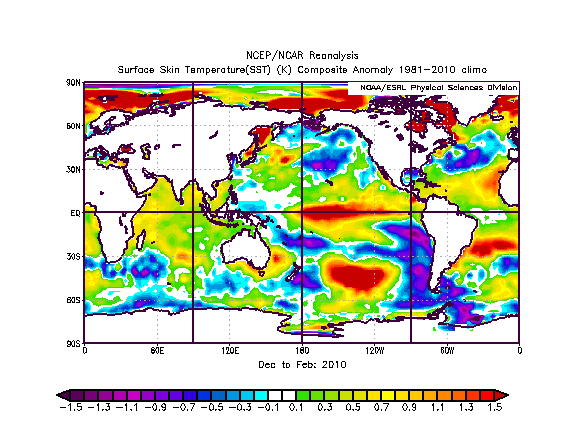
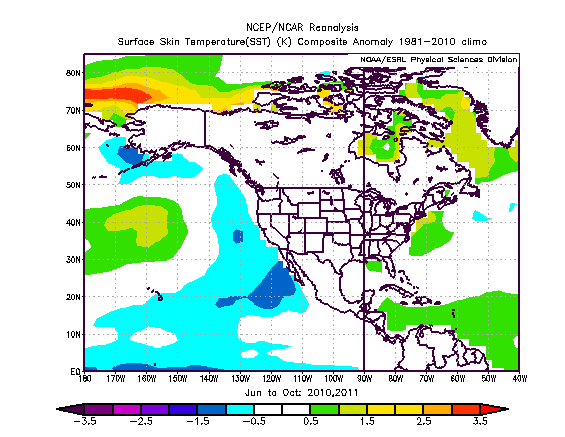
The map below shows the cooler waters in the tropical Atlantic with anomalously warm water in the Gulf of Mexico and near the East Coast.
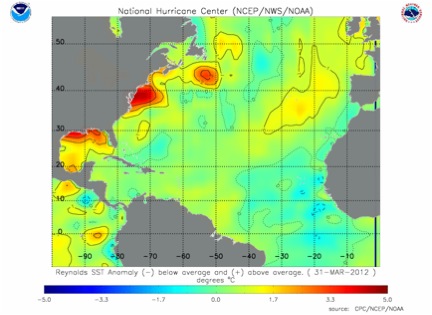
The Atlantic is cooling down, but with very warm water near the US coast for the front and mid part of the season, the irony
of fewer storms with more challenge may be the story of this season.
A detailed look at the 2012 Hurricane Season can be found on the WeatherBELL Premium and WeatherBELL Commercial sites. Joe Bastardi's 2012 Hurricane Forecast, published in March, can be seen below.
March 29, 2011
Hurricane comment via the WeatherBELL Tropical Page on the Commercial site:
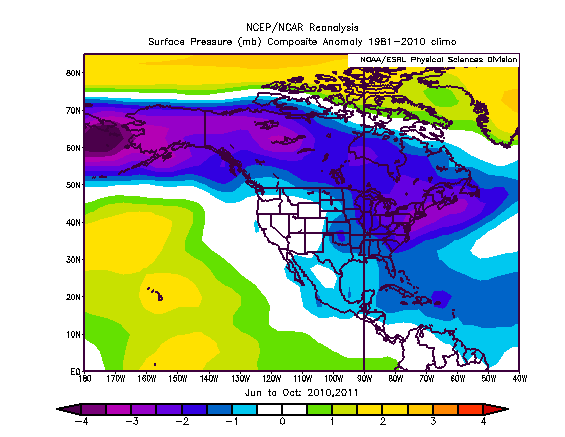
The European computer forecast indicates to me that this is not a season for major long-tracked storms. A look at the pressure forecast reveals high probabilities for higher than normal pressures in the tropics and lower than normal rainfalls.
Pressure: This means smaller than normal storms in the tropics. The major problem is development out of the deep tropics since it implies enhanced convergence further north and over the Pacific.
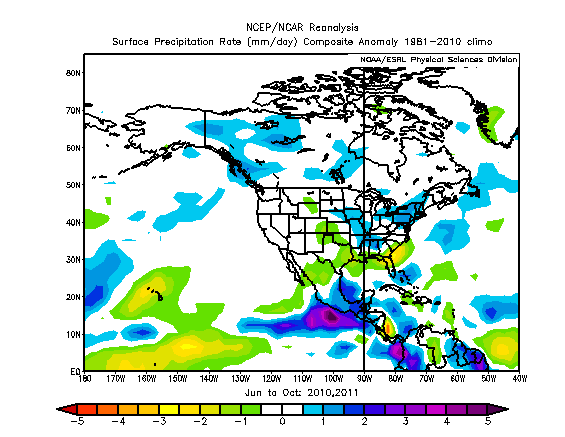
The rainfall pattern backs it up:
However, the JMA says a lot of rain will develop over the western Gulf and much of the South in the fall season:
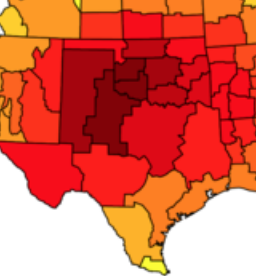
along with an amazingly cold planet, though a patch of warm is over the Southeast:
My take: Lower than normal ACE in the range of 75-96, but more landfalls than last year because of developments that will occur out of the deep tropics are close to the coasts. While the total package may be down, the focus of the package may be close to the coast rather than out to sea.
If we look at last year and the year before, we see a major congregation of tracks over the Atlantic Ocean, but far enough away from the States to avoid the kind of high landfall seasons as we saw in '04, '05 and '08.
2010
2011
a look at pressure reveals lower than normal pressure in the tropics, opposite the forecast this year:
Higher than normal rainfall in the tropics, with drier than normal in the Pacific where it is forecasted this year to be wetter than normal:
and finally, warmer than normal water in the tropics, where it's forecasted to be cooler than normal:
All these point to a reduction in overall number.
However, while the number of storms and ACE is down, the problem is that the modeling, with heavy rains and reduction of water temperatures where it starts warm in the spring and ends up cool in the fall implies that there must have been enhanced storminess overall near the coast, though off New England that may be because of the cold fall forecasted.
March-May


However we come up with this, as far as the idea goes:

March 1, 2012
The 2012 hurricane season should be comparable in ACE Index to last year, but I am anticipating lower numbers overall, assuming TPC has some degree of reasonable ideas as far as naming. What we should do is divide the Atlantic Basin into two areas; one of them east of 60 West, north of 30 North, and any storm that forms in this area should not be classified with the hurricane totals unless it moves west of 60 West. This is so "willy nilly, satellite-estimated storms" don't stack the number. Last year was a joke- an ACE index of 122 with 19 names.
I continue my call for an easy-to-follow objective naming scheme. Systems over water of 25 degrees C or greater with a closed rotary circulation and verified gales in at least one quadrant should be named. In addition, a power rating to the storm, my scale for instance which incorporates a pressure from 1-5 along with the recon wind, and an adjustment up or down depending on pressure tendency, not to exceed one full category, would open up a 1-10 scale and give us a better look at the overall power of the storm. I will rehash that in the future, but the pressure means something: be it tight and increased wind at the center, or spread out meaning less wind at the center, but strong in a larger area and chances are, enhanced rainfall and staying power.
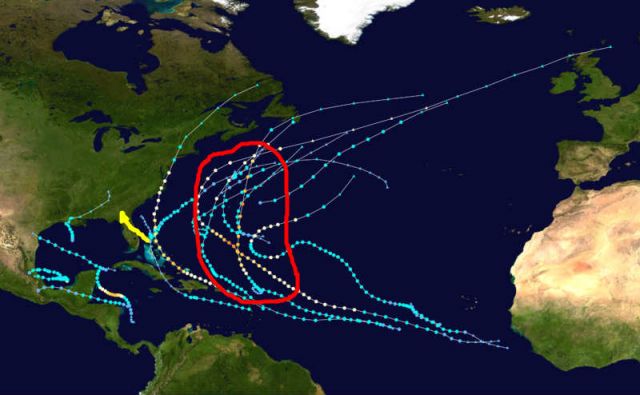
The forecast basis is simple. I believe in the decadal sense we are in the period 1948-1957. The season last year had Irene on the western side of an envelope of cyclone tracks of late to intensify storms, and one can see the congregation of tracks theory worked, but was further east than what might have occurred. The congregation of tracks is outlined in red, and in yellow the non-named fiasco that hit Florida in mid-October with an eye and 80 mph wind gusts.
The reason for the tracks there may have to do with a cool pocket in the heart of the hurricane intensification region east and northeast of the Windwards. The 400 mb level had this:
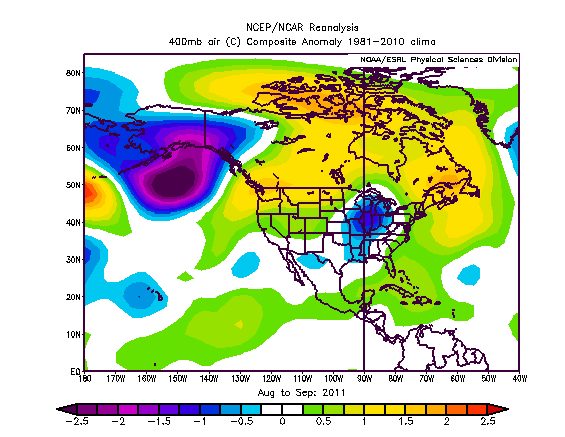
with the greatest warmth relative to normals further north, across Canada. I have opined that the warmer it is to the north in a given season the more distortion there is to the upward motion patterns that can occur in the tropics. If we look at the big seasons of '05 and '08, we see the warmest is close to the US coast over the Southeast and Gulf,
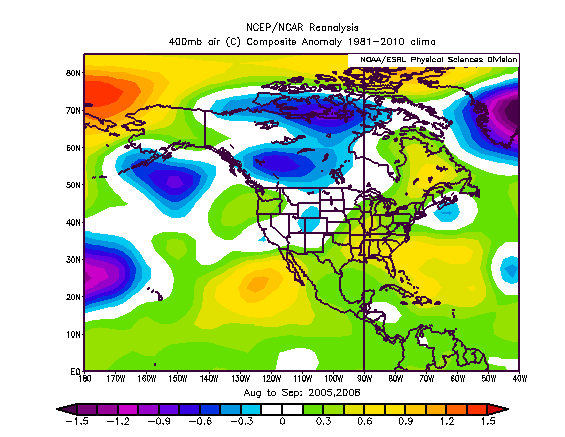
and while there is a "cool pool" in the Atlantic, it is north of the tropical breeding ground and it's much colder across Canada. In any case, the only place the storms had the warmth available above 500 mb was in the area we saw the ones that did intensify. A big key to active seasons is the bundling of heat over the tropics at levels where the storm does not consistently have to work to build its warm core. Cooler or drier air forces the storm to work harder in the development stages and can retard growth. The theory last year was we would get the warmth near the coast, but centered more south, as you see here. As it is, tracks moved west 300 miles and the East Coast would have had a year like the middle 50s (as if Irene was not enough).
The current forecast is based on the years 1948-1957 where I think we are in the timeline of the decadal shifts of the oceanic cycle. The PDO turned cold in 1948 and did so again around 2007. The AMO is warm overall, though it has cooled a bit from last year. Still the factors considered have to be the big decadal players and within them the state of the ENSO. There are two years within this larger set, 1951 and 1957, where cold ENSO events reversed to warm and that is what is expected here. Also in the mix is 2009, which is factored in and has to be considered.
Before going on, let me lay the numbers out:
ACE Index: 105-120, which is near normal
11-14 storms, 6-8 hurricanes, 2-4 major
The weights are such that each year from 1948 through 1957 is weighted once, with 1951 weighted three times, and 1957 and 2009 twice.
This argues for 3 or 4 landfalling storms, where 2 or 3 are hurricanes with one tropical storm. The East Coast, as per the 1950s, would have an enhanced threat relative to the rest of the coastal averages. One of the other reasons is El Nino seasons tend to have storms with more movement north rather than due west, and then sharply northeast.
Looking at the JMA Sea Surface Temperature forecast, we see striking similarities to the recent weaker year of 2009. The February forecast for sea surface temperatures for the summer that year looked like this:
This year it looks like this:
.gif)
Both have an El Nino developing with a visible cold PDO in horseshoe fashion in the Pacific and the same in the Atlantic, though not as strong.
The September to November maps look like this from February of 2009:
.gif)
.gif)
The cold PDO signal remains, the Atlantic is very similar to 2009, but the El Nino is not as strong yet. My point is that one should expect less of a year overall and the correction here may be down.
This is actually an amazing set of maps, It's hard to believe something can be that close. It may be saying some things about next winter, which of course I will discuss in the winter section.