Summer 2017 Outlook 7 years ago
February 23, 2017
- New El Niño emerging.
- Playing field very warm to start.
- Unlike last year the warmest part of the summer should be in front.
- Chance for cooler midsection especially from August onward.
- Hurricane comment follows.
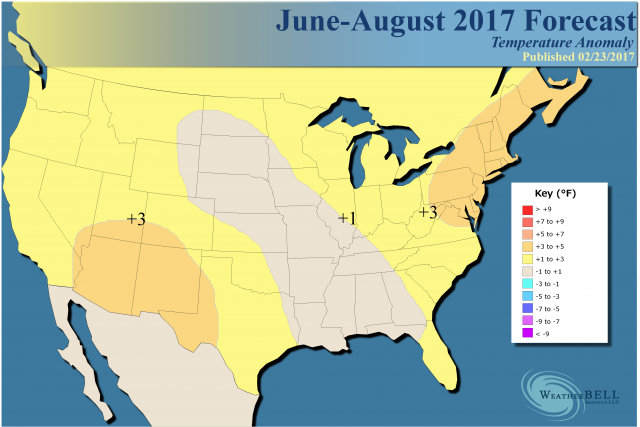
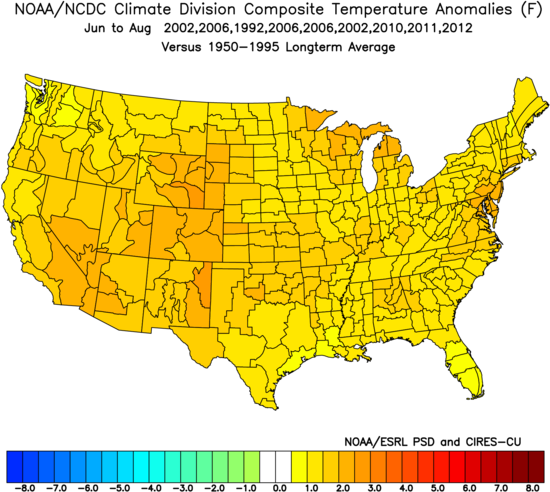
The actual analog package looks like this (note we used an older average so the map captures the warmth):
This is very close to a blend of the Euro, the JAMSTEC and the CFSv2.
The JAMSTEC:
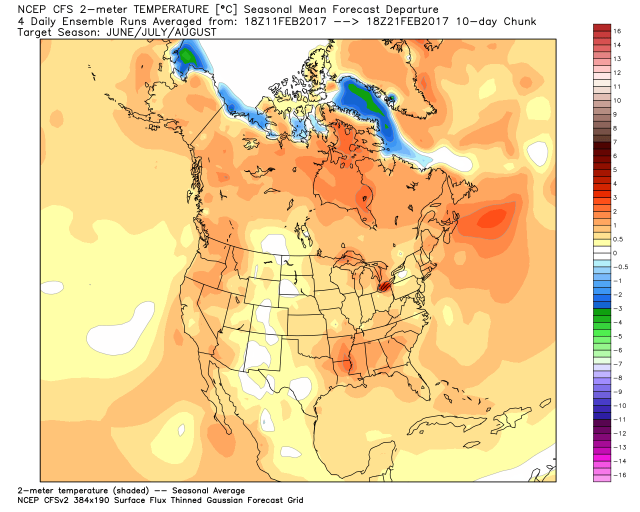
The CFSv2:
Discussion
The current SST map shows a cold eastern Indian Ocean:
.png)
There has been a warm Nino1+2 off the coast of South America, giving us good reason to believe another El Niño may be on the way. I do not believe this will be as strong as the Super Niño of 2015-16, but I do believe it is coming. The SSTs to the west of Australia are similar to 2009 and 2006 at this time.
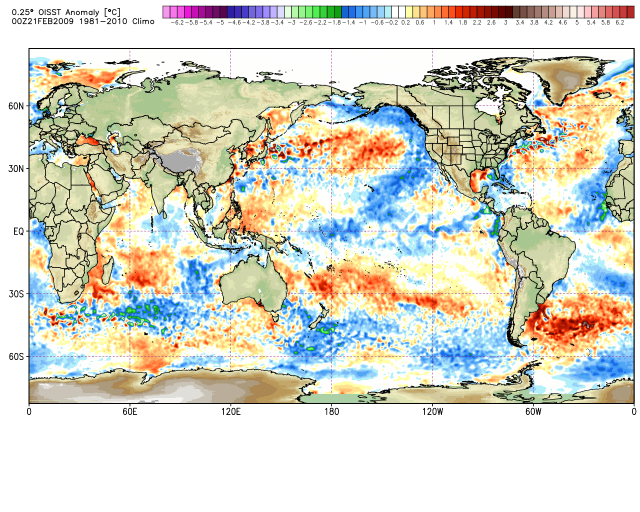
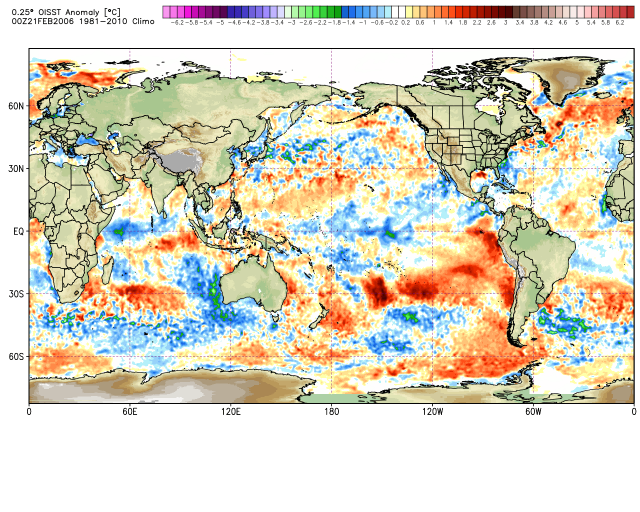
An El Niño event close to those years is likely evolving.
.gif)
It is important to note that dynamical models have a hard time forecasting SSTs in the spring. This is known to meteorologists as the "spring predictability barrier," so expect some fluctuations in the forecasts until we get into the summer.
From what we see, this may evolve into a "Modoki" event, more in Nino3.4 than Nino1+2 as the summer evolves. This may have implications for next winter, but likely not yet for the summer.
There is a big jump, though, on warmth, and the two closest El Niño summer patterns to this one are 2002 and 2006. Again using the older normals to create the warmer look:
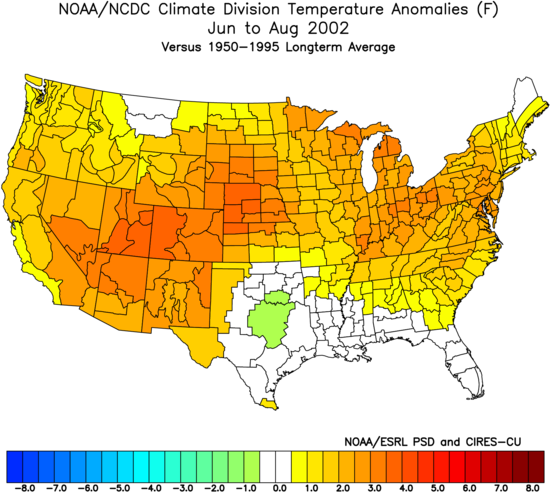
We can't really use that because in both of those years the Gulf of Mexico was cool, not like it is now. The record early season western Atlantic and Gulf of Mexico warmth is going to play a role, and because of that the forecast looks it does above.
Note on Precipitation
We may find this to be a case of wet and warm, as the SSTs surrounding the eastern and southern U.S. are well above normal. As the El Niño evolves, there is a tendency for more troughiness to try to develop over the nation's midsection, which would set up a clash.
The current 10 runs of the CFSv2 have this:
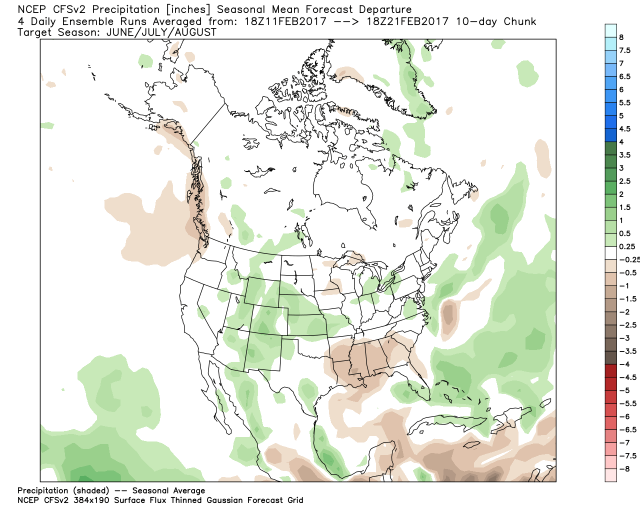
This leaves the Southeast the driest, but it also shows enhanced moisture over the southern Rockies, which would back the CFSv2's attempt at being cooler there. This does not appear to be in the same league as some of the hot and dry summers we have had with La Niñas that responded to the 2009-10 El Niño and the soil moisture configurations. Instead, it appears to be a warmer and wetter looking summer.
There is also the very important matter of spring soil moisture feedback, which we cannot yet tell if and when that could be an influence on the early summer pattern. We have long term drought in the Southeast and from the northern Mid-Atlantic to southern New England:
.gif)
The short term drought blends have dryness in the Southeast and along the Mississippi Valley.
.gif)
We will have to watch this evolve through March and April, as a lot of times a heat ridge can establish itself where drought feedback is strongest - many times where the short term and long term drought coincide.
The Verdict
There are arguments as to where it's going to be warmest, but the loudest message is that an above normal summer is on the way. However, we feel this will be more front-loaded than last year, which had a sputtering start before really hitting the endless summer stride in July-September. A widespread warm, more classically centered summer is the call. The place to look for cooling to develop first relative to averages is from the Plains into the Southeast.
Hurricane season
I am looking for a lower ACE total than last year, and likely a bit below normal. My initial numbers are 70-90, but over half of that ACE may be to the north of 25°N and to the west of 65°W. However, there is no impact map I can draw at this time, as this is an in-close season again. I cannot just single out any one area at this lead time.
The danger of an El Niño season in spite of overall numbers is well known, with some huge names showing up. Of major interest is the lack of tropical activity in the Southern Hemisphere, with ACE at less than 20% of normal at a time when activity is typically over 60% done. Years with an ACE under 200 in the Southern Hemisphere have averaged 77 in the western Atlantic, but some big years showed up like 1995. However, if we just look at years when an El Niño came on, with a lack of activity, they were under 50!
Still, we have not seen water this warm in the preseason during the satellite era, as even last year there were some cool pockets in the Gulf of Mexico. This is a warmer version of a cold AMO - in other words, when we look at the Atlantic there is a ring of cool (more appropriately less warm) as there was last year, but we correctly surmised that there was no reason to use years that had El Niños as the one we were in was collapsing and evolving into La Niña. This year, it's the opposite, as there is probably one coming on. That being said, it matters not that the MDR may be way below normal, it is slow moving storms in-close (using the very warm water) that can cause problems.