Final 2016 Hurricane Forecast 8 years ago
May 15, 2016
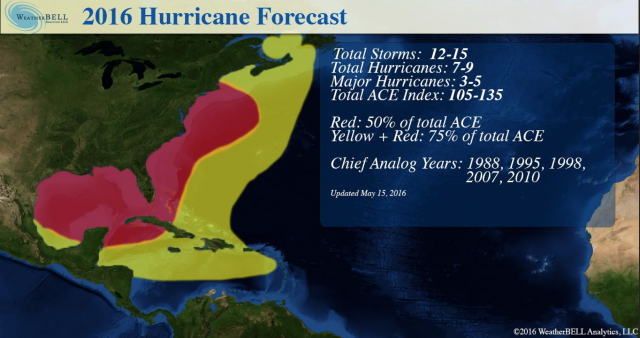
- More active season than last year
- El Niño transitions to La Niña
- Gives us 5 recent analogs
- 1988, 1995, 1998, 2007 & 2010
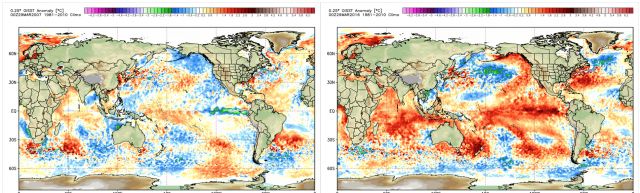
- Gulf of Mexico and western Atlantic much warmer now than those years
- No changes in total ACE, but area of highest ACE was expanded to include East Coast
- Total numbers now include Alex, so no change on new storms, but allowed for Alex being included
- Concern about early season development
The first forecast, issued at the end of March looked like this:
.jpg)
This was remarkably similar to the NMNE that came out in May, so it appears our ideas predated at least that model.
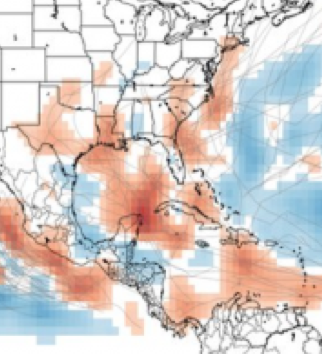
.png)
I have not seen anything to discourage that. However, notice it does see activity up the East Coast. The new Euro also increased its chances along the East Coast, especially farther to the north. Given the warmth of the water, I think that is a wise idea and so the map has changed to this:
Note that for simplicity's sake the new map also includes data from Hurricane Alex (back in January), whereas the old map was only for new activity.
Analogs
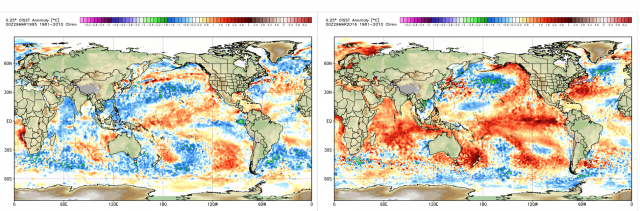
Let's look at the analogs and the changes since the first issuance In March. In the 1988 season, the La Niña was already coming on gangbusters, but the in-close water to the U.S. was much cooler in March:
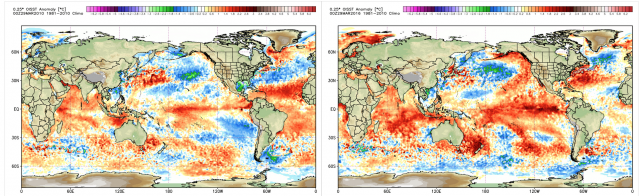
The current comparison (May):
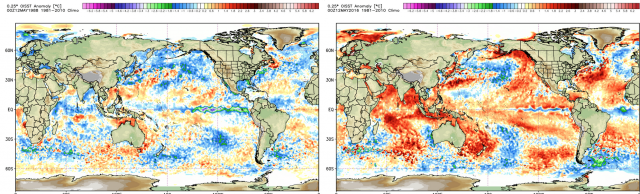
The overall cool look in 1988 near the coast remains. Since then, the El Niño has shrunk dramatically as colder water is now appearing. The Atlantic, compared to 1988, is boiling overall, and has also warmed off Africa.
The total ACE was 103 in 1988:
Through March, in 1995, the water was much cooler off the East Coast, while the Gulf of Mexico was comparable. The La Niña was more established, there was a marginally positive PDO and a similar eastern Atlantic:
In 1995 the water was much colder off the East Coast and warm water was focused in the MDR to the east of 65°W. This was a good set up for a big ACE total (like 2010) but not for high impact. This year, that very warm water is farther to the west and that means what we are showing on the maps - the threat of stronger storms farther to the west. So we are not anticipating the mega ACE totals of 1995, but the tracks that year were mainly away from the U.S. (there were sort of two seasons, one a lesser one in the Gulf and the main one in the Atlantic).
The latest comparison to 1995:
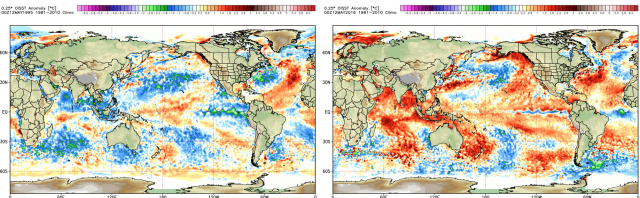
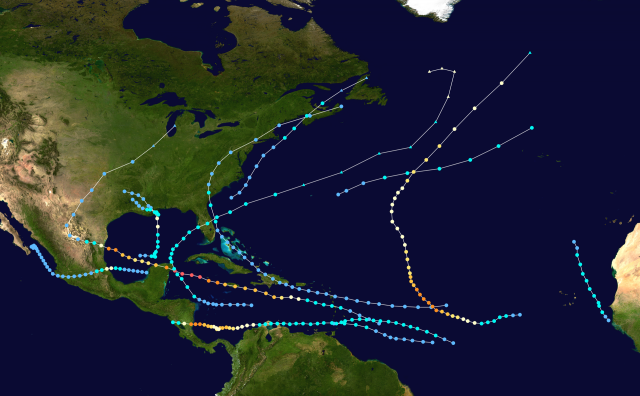
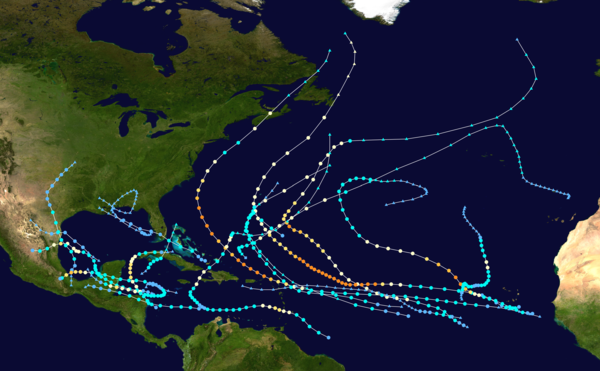
Total ACE was 228:
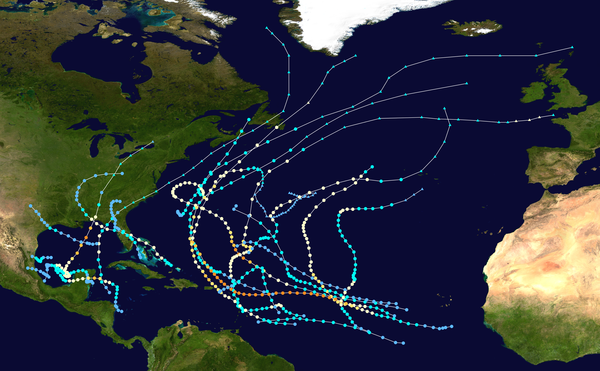
Notice the two clusters of tracks, avoiding the preseason colder water off the Southeast Coast.
In March 1998 the El Niño was in a similar state of decay, but again the water this year was much warmer near the U.S. Coast, well off the East Coast and in the Gulf of Mexico:
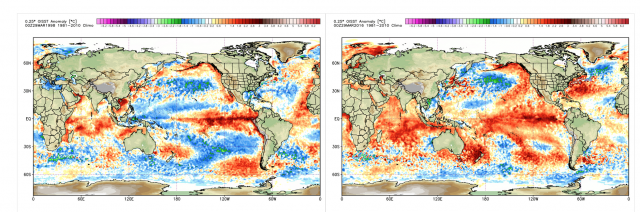
In May, it now looks like this:
.png)
The El Niño was still raging in Nino1+2 and it was stronger farther to the west. The Atlantic basin had a look for a mega ACE total in 1998, with the cold water in the Sargasso Sea and warmth in the Main Development Region. Again, it's years like that when storms may be reluctant to get into the western Atlantic, so only Bonnie ventured in. We are emphasizing it's not the overpowering ACE this year, but a lot of it may be in-close.
The total ACE was 182 in 1998:
.png)
In March 2007 the La Niña was already becoming evident, with warm water near the U.S. coast. The PDO was negative though:
The current map in May:
.png)
There was a warm over cool anti-ACE signature in the Atlantic that year, but quite a bit greater than this year.
In 2007, the total ACE was 72, but we are looking at a stronger year this year.
.png)
2010 had a great look for a high ACE season in the Atlantic, a classic set up in the MDR SST pattern. Again cool water was present to the west and storms avoided the U.S. for the most part. As far as big storms near the East Coast, not much occurred with water so cold. El Niño was still in the process of reversing and the PDO was colder than now:
The current setup in May:
.png)
The El Niño was falling apart about as fast, though the one this year was much stronger.
Total ACE was 165 in 2010. Again notice a lot of tracks were out to sea:
So we have two years that are down years, but three big years.
Note on SST configurations
In the heart of the hurricane season, higher 1000-500 mb thicknesses than normal to the north of the MDR distort the pressure pattern in the MDR, so the convergence for long–tracked storms is not as favorable. I need to explain this as this is part of an idea I have been using in the last couple of decades. The function of tropical cyclones is for nature to re-distribute heat out of the tropics into the temperate regions. One of the reasons the hurricane season comes to life in the fall is because the mean pressures over North America begin to rise while they continue to fall over the tropics, leading to enhanced convergence over the tropics if there is no big source of rising pressure in the northwestern Atlantic or if pressures relative to normal are low over North America.
It's interesting that old timers (and maybe I am one of them now) always look for big highs to show up August 15-October 15 for mayhem underneath, even if there was no apparent reason at the time. An example, though past October 15, was Sandy:
More classic is Carol:
The very warm northwestern Atlantic waters would mean that pressures are naturally lower than normal farther to the north than south in the western atlantic, which retards the overall number. When we get into the time of year where pressures start to rise because of the seasonal change over land, the warm water is a) low level fuel for storms that do develop and b) can support the 500 mb ridge over northwestern Atlantic more.
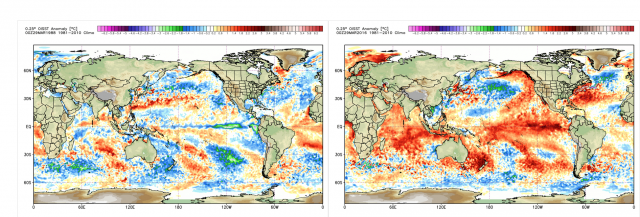
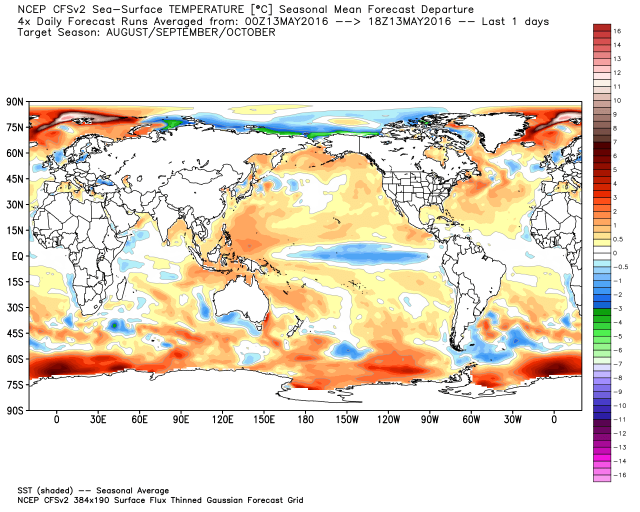
So let's take a look at the SST forecast for the hurricane season. I think the CFSv2 is doing better now:
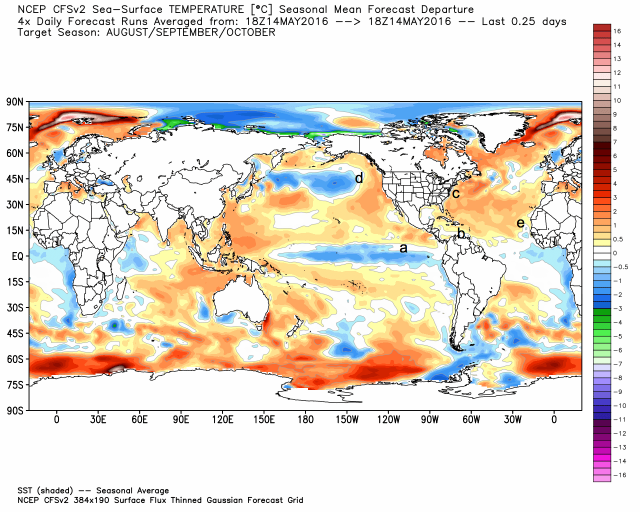
Notice the labels that were put on the map. The a versus b relationship is a positive as it means that pressures in the means will be higher off the northwestern coast of South America and lead to enhanced convergence over the southwestern North Atlantic basin. Perhaps that is what the NMNE is seeing:
C versus B is not favorable for big numbers but for intensity. When storms get to the west, they are. I wish I could show the Euro hurricane forecast off its site, but it has increased the intensity forecast in the northwestern Atlantic while maintaining a slightly below normal ACE. The warmer water to the north of the MDR is not what we look for in a mega ACE season.
In the Pacific the warm ring remains and with the warmth off the East Coast. As the seasonal changes take place, it implies a trough between 500 mb ridges that would be farther to the north than normal, perhaps near or to the north of 50°N over western Canada and eastern Canada. So the alley is there. Again it may be what the NMNE is seeing in support of our idea.
The idea here (it's something those of you that have watched me over the years know is another pet of mine) is that if you can bundle heat in the tropics, rather than spreading it out, you get the more active seasons. So this is an ACE, more than impact discussion and I didn't want to get bogged down here. I am not aware of this in any textbooks, but 20 years ago, no one was talking about the "typhoon rule" either.
A colder central Atlantic and a warmer MDR tend to lead to higher 1000-500 mb thicknesses over the MDR TO THE SOUTH of the cold water, where water is warm, and with the water warm, and pressures tending to be higher closer to land, there is extra convergence because of that. So more storms develop.
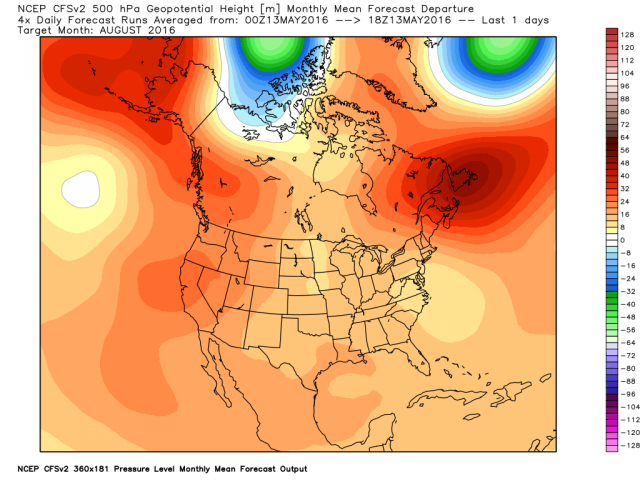
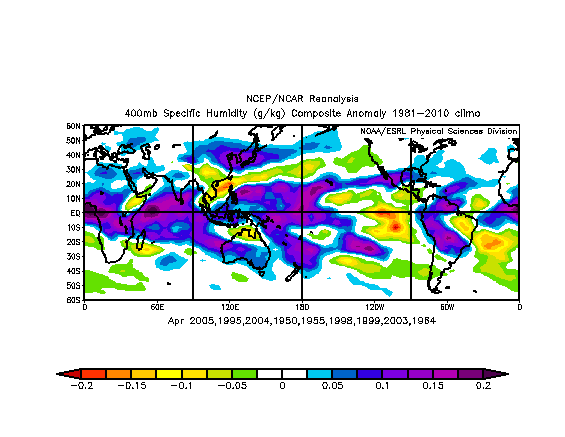
So the bottom line of all this it's the 400 mb specific humidity (below) that I feel is pointing the way at the result of all this. It's actually moist, not dry over the tropics. We have storms that may be slow to form, until they get close to land. In addition, the SSTs surrounding the U.S. naturally promote ridging farther to the north than normal over eastern North America, as there is feedback from the warm water. That occurs many times in the heart of the hurricane season. We see runs on the CFSv2 hinting at that (yes I know I trash it all the time) but when it's showing what you are coming up with, like the NMNE, you at least think, "Well the model is seeing what I am seeing."
Here is an example:
2016 Season Setup
While the pattern setting up now has a huge high pressure in the eastern Atlantic (a known negative for high ACE), the warm water near the U.S. ups the ante for in-close activity. So we have to balance that in and come up with a more or less average number, but the worry is for big storms in-close.
As far as ENSO, the CFSv2 was "fixed" and has now come around to the La Niña ideas of the other models. So I have no problem in showing the latest CFSv2 for August-October for the Pacific pattern, but the Atlantic Basin its still too cool. I don't think this fix is all it's cracked up to be, as constantly cooling the Atlantic affects what happens globally.
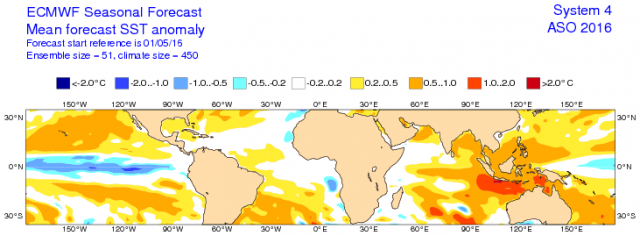
Both the ECMWF and the CFSv2 (above) show a warm over less warm SST pattern, which is not conducive for a mega ACE year, as discussed with some of the analog years. So we don't have that.
The Euro:
The UKMET, at 120% of normal ACE, appears to be in our camp with that (it's our camp, since ours came first ha ha).
One additional thing, my pet, the Specific humidity in the preseason over the tropics, is rather bullish.
This year:
.png)
Top 10 ACE years:
Since our forecast is a bit above normal and there are other reasons (like the modeling) to suspect there won't be a very active year, I prefer to stay where we are.
Note about the early season development idea
With major ridging forecasted to end May and start June over the Northeast and the separate stream that is tailing off, the concern is there for an early season storm. Post El Niño seasons have that as often as not (examples 2007, 2005, 2003, 1995 and 1966 off the top of my head). So we do see a pattern that could lead to that.
The Verdict
- Total ACE: 105-135
- Total named storms 12-15
- Hurricanes: 7-9
- Major Hurricanes: 3-5
- Chief analog years
- 1988, 1995, 1998, 2007 & 2010
POWER AND IMPACT SCALE
I believe that the scale I have developed, incorporating pressure and pressure tendency, is a much better indicator of the impact that a storm will have over a larger area than the Saffir-Simpson scale. Let's take Ike and Sandy. The scale uses the pressure categories 1-5 and the wind categories 1-5 on the Saffir-Simpson scale to come up with a total 1-10. A rapid deepening storm, more than 3/mb hour, gets an extra point tacked on, 1mb/hour a half point, and vice-versa for weakening. The physical reason for this is that a rapidly deepening storm is indicative of feedback mechanisms working so well that the storm is able to produce the maximum wind it's capable of. Conversely, if weakening rapidly, it's likely not to be able to bring that to the surface.
Ike at 953 mb was in the mid-range of Cat 3, "3.5" for pressure. Winds were reported at 110 mph, which is about 2.75 for wind. This made Ike on my scale a 6.25, which is a major hurricane. Gustav was about the same. Do you think for one second 75 years ago before all the categorizing we see now, those storms would not have been recorded as majors? More importantly, they did major damage. By the way, even though it might be technically true by way of the Saffir-Simpson scale, I believe it's not right to claim that the U.S. has not been hit by a major hurricane since 2005. Gustav, Ike and Sandy all were major impacting hurricanes and had the damage to prove it (though over a larger area). This is why the overall power of the storm in relation to other storms is approximated much better with my scale.
Sandy, at landfall, had a 946 mb pressure (verified by land observations at a barometer that was calibrated to within 0.5 mb several times when I was home at Somers Point, NJ), which is about a pressure of 3.75 on the Saffir-Simpson scale. Sandy was weakening off its peak several hours before, so the pressure is adjusted to 3.25. Winds were at 85 mph, which is a 1.5. Sandy goes down not as a Cat 1 hurricane but a combined 4.75, which is healthy Cat 2 (if we are going to chop it in half). This ranking certainly does it more justice.
While I am not holding my breath about this being adopted, I will from time to time reference it so we can have a better idea of the total picture of the storm. It's the old argument, the slugger (my power scale) or the boxer (the more "proper" Saffir-Simpson scale).