2016 Hurricane Season Forecast 10 years ago
March 31, 2016
- More active season than last year
- El Niño transitions to La Niña
- Gives us 5 recent analogs
- 1988, 1995, 1998, 2007 & 2010
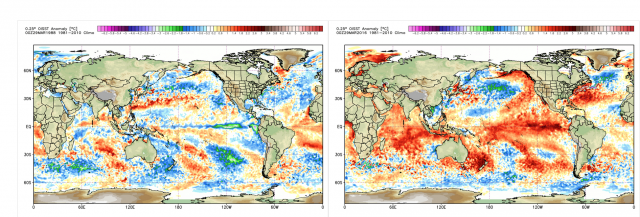
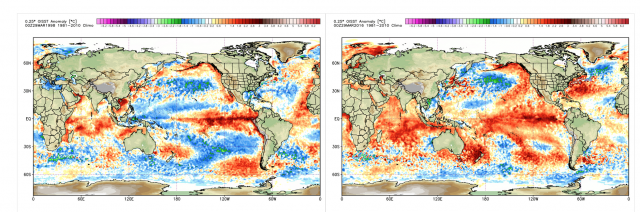
- Gulf of Mexico and western Atlantic much warmer now than those years
- Unfavorable eastern Atlantic pattern argues against mega year.
.jpg)
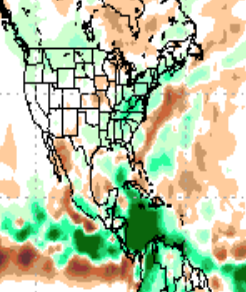
The total ACE forecast of 105-135 is down from the early March preview based on some of the negatives we still see. The big concern is where the worst part of the season is supposed to occur. I am saying 50% of the total ACE this year will be in the Gulf of Mexico or western Caribbean. A Joaquin-type storm milling around in the Gulf, for instance, is a potential problem scenario. If there is one, nothing is stopping there from being a couple.
Analogs
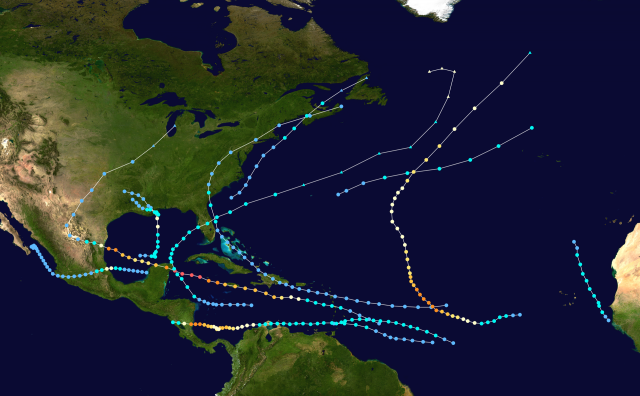
In 1988, the La Niña was already coming on gangbusters, but the in-close water to the U.S. was much cooler:
The total ACE was 103:
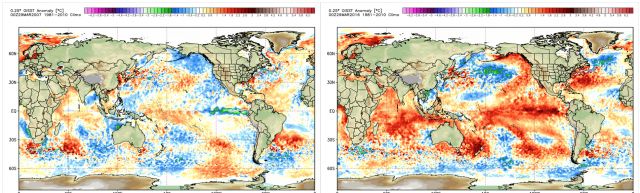
In 1995, the water was much cooler off the East Coast, while the Gulf of Mexico is comparable. The La Niña was more established, there was a marginally positive PDO and a similar eastern Atlantic:
Total ACE was 228:
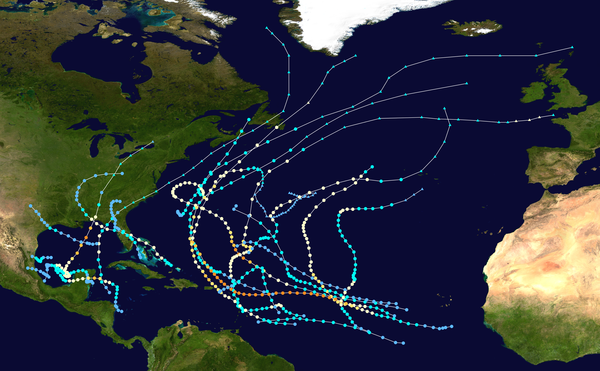
Notice the two clusters of tracks, avoiding the preseason colder water off the Southeast Coast.
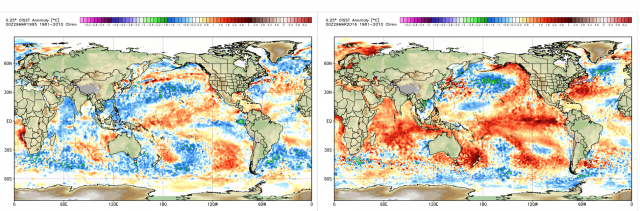
In 1998 the El Niño was in a similar state of decay, but again the water is much warmer near the U.S. coast, well off the East Coast and in the Gulf of Mexico:
The total ACE was 182:
.png)
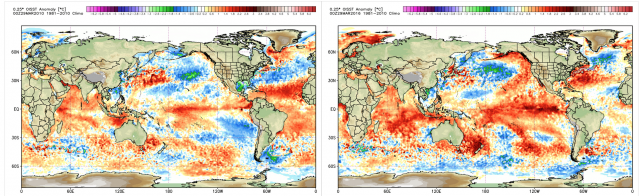
In 2007 the La Niña was already becoming evident, with warm water near the U.S. coast. The PDO was negative though:
Total ACE was 72:
.png)
2010 had a great look for a high ACE season in the Atlantic. As far as big storms near the East Coast, not much occurred with water so cold. El Niño was still in the process of reversing and the PDO was colder than now:
Total ACE was 165:
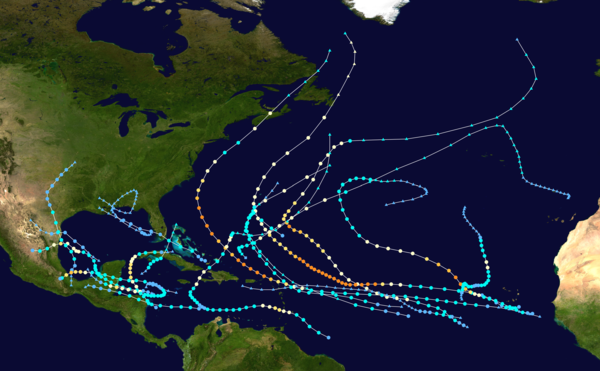
So we have two years that are down years, but three big years.
2016 Season Setup
While the pattern setting up now has a huge high pressure in the eastern Atlantic (a known negative for high ACE), the warm water near the U.S. ups the ante for in-close activity. So we have to balance that in and come up with a more or less average number, but the worry is big storms in-close.
We have very warm water in the Gulf and near the East Coast this year. Models are showing enhanced rainfall in the summer and fall. The example shown here is the JAMSTEC:
As far as ENSO, the CFSv2 was "fixed" and has now come around to the La Niña ideas of the other models. So I have no problem in showing the latest CFSv2 for August-October for the Pacific pattern but the Atlantic Basin its still too cool. I don't think this fix is all it's cracked up to be, as constantly cooling the Atlantic affects what happens globally.
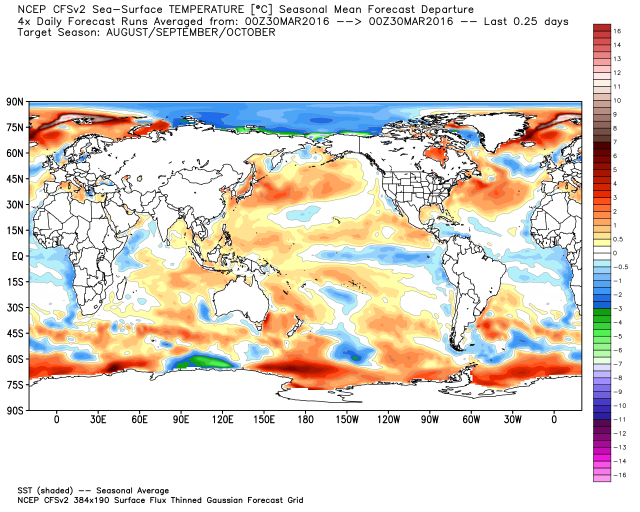
It has a cold Atlantic Main Development Region, though, and it remains at odds with every other major model there. The example here is the European:
.png)
The Verdict
- Total ACE: 105-135
- Named storms: 11-14
- Hurricanes: 6-8
- Major Hurricanes: 2-4
- Chief analog years
- 1988, 1995, 1998, 2007 & 2010
POWER AND IMPACT SCALE
I believe that the scale I have developed, incorporating pressure and pressure tendency, is a much better indicator of the impact that a storm will have over a larger area than the Saffir-Simpson scale. Let's take Ike and Sandy. The scale uses the pressure categories 1-5 and the wind categories 1-5 on the Saffir-Simpson scale to come up with a total 1-10. A rapid deepening storm, more than 3/mb hour, gets an extra point tacked on, 1mb/hour a half point, and vice-versa for weakening. The physical reason for this is that a rapidly deepening storm is indicative of feedback mechanisms working so well that the storm is able to produce the maximum wind it's capable of. Conversely, if weakening rapidly, it's likely not to be able to bring that to the surface.
Ike at 953 mb was in the mid-range of Cat 3, "3.5" for pressure. Winds were reported at 110 mph, which is about 2.75 for wind. This made Ike on my scale a 6.25, which is a major hurricane. Gustav was about the same. Do you think for one second 75 years ago before all the categorizing we see now, those storms would not have been recorded as majors? More importantly, they did major damage. By the way, even though it might be technically true by way of the Saffir-Simpson scale, I believe it's not right to claim that the U.S. has not been hit by a major hurricane since 2005. Gustav, Ike and Sandy all were major impacting hurricanes and had the damage to prove it (though over a larger area). This is why the overall power of the storm in relation to other storms is approximated much better with my scale.
Sandy, at landfall, had a 946 mb pressure (verified by land observations at a barometer that was calibrated to within 0.5 mb several times when I was home at Somers Point, NJ), which is about a pressure of 3.75 on the Saffir-Simpson scale. Sandy was weakening off its peak several hours before, so the pressure is adjusted to 3.25. Winds were at 85 mph, which is a 1.5. Sandy goes down not as a Cat 1 hurricane but a combined 4.75, which is healthy Cat 2 (if we are going to chop it in half). This ranking certainly does it more justice.
While I am not holding my breath about this being adopted, I will from time to time reference it so we can have a better idea of the total picture of the storm. It's the old argument, the slugger (my power scale) or the boxer (the more "proper" Saffir-Simpson scale).