



-
July 8, 2026, 6:30 a.m.
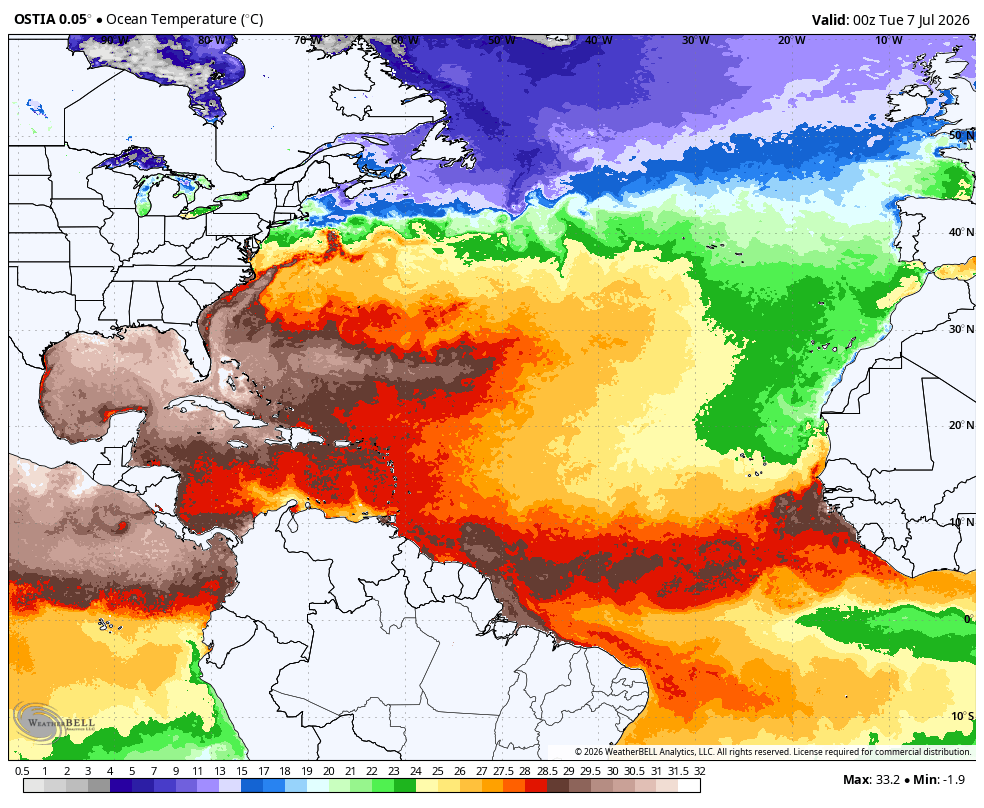
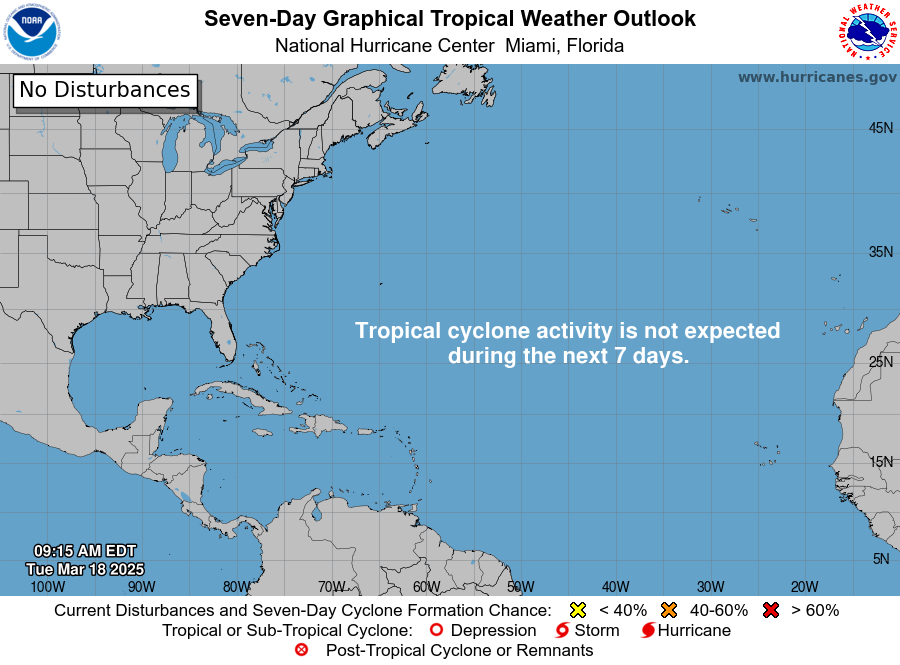
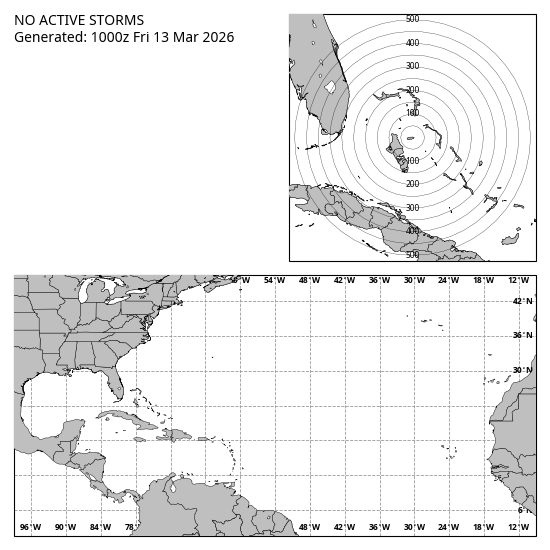
- The Tropics are quiet for now.
The MJO is forecasted to go into Phase 8:
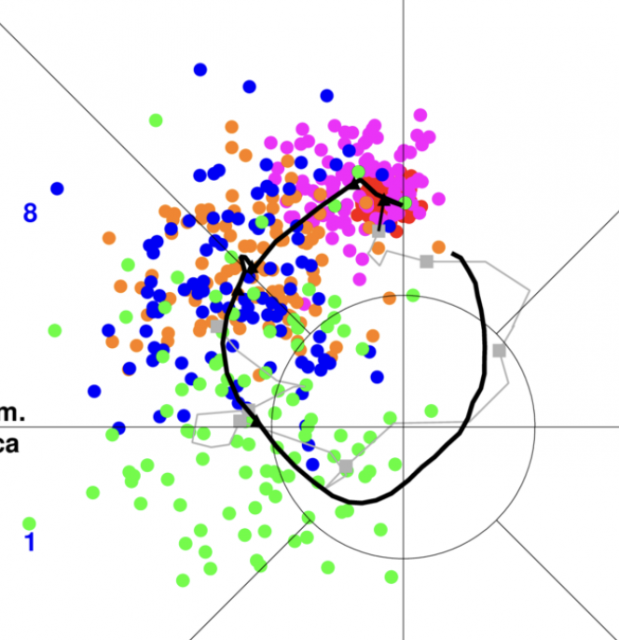
If it can get stronger, another in-close mischief-maker could show up later in the month.
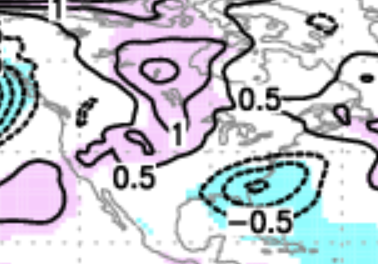
The Phase 8 Sea Level Pressure correlations in July suggest looking at the coastal area off the Southeast:
July 7, 2026, 6:30 a.m.
- The Tropics are quiet for now.
The MJO is forecasted to go into Phase 8:
.png)
If it can get stronger, another in-close mischief-maker could show up later in the month.
July 6, 2026, 6:00 a.m.
- The Tropics are quiet for now.
The MJO is forecasted to go toward Phase 8:
.png)
If it can get stronger, another in-close mischief-maker could show up later in the month.
June 10, 2026
- A powerful El Niño is developing.
- This will be a significant ONI (Oceanic Niño Index) event.
- The closest analog is 2015.
- There are no changes to the forecast numbers.
- The impact forecast has the highest chances, relative to normal, in the northwestern Atlantic.
- There is always the threat of one (un)lucky punch.
- The Western Pacific will take up the global slack.
- A higher impact season for Mexico is on the table.
The forecast numbers for the 2026 season
Total storms: 9-13
Hurricanes: 3-5
Major Hurricanes: 1-2
Landfalling U.S. hurricanes: 1-2
Impact storms on the U.S. when at least a warning is issued: 3
ACE Index: 85-105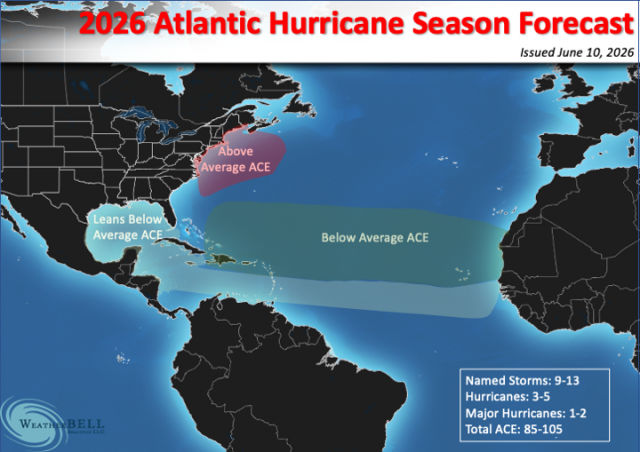
Let me explain the map. Relative to the average ACE in the areas above, I expect the northwestern Atlantic to be the only place above average. That area averages 10-15 ACE points a year. So I am expecting it to be more active there.
Farther to the south, in areas with higher average ACE, I expect a large area of below-normal ACE. I lean below in the other areas because of the puncher's chance I was talking about. There have been major hurricanes in the Gulf in El Niño years. Betsy is legendary (Audrey in 1957 is too, but it was earlier). Anita in 1977 went full bore, Category 5, but stayed to the south of the Lower Rio Grande Valley. 2002 saw Lili and Isidore, the only two Category 4s in the Gulf within 10 days of each other. Neither hit the U.S. as a major hurricane, though. Interestingly enough, it's much of Florida to Cape Hatteras that has not had at least one big hit in El Niño seasons. The Northeast has had Bob and Belle.
This is more like 2015 (which had Joaquin for the Bahamas):

So I am jumping on that analog.


This El Niño means business:

Now that we have a good look at the Euro, its message is strongly bearish on the overall season and well below the averages since 2015.
SST forecasts
First of all, the 2023 hyper-El Niño season saw a nice warm stretch in the Atlantic.
.png)
The SOI for that El Niño revealed a Pacific pattern unlike most El Niños, despite warmth farther to the east. This allowed the big numbers we had then, so that the analog has been taken out.
The hyper 2024 season, which we picked out in the prior December, featured the ultimate setup with a weak La Niña and a large area of warmer-than-average SSTs in the Main Development Region of the Atlantic.
.png)
You could see this happening already in December 2023. Hence, we had our forecast out early, and the results spoke for themselves.
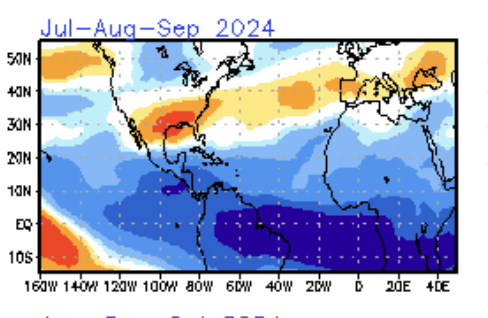
The pattern was ideal with all the storms hitting in the target area between the center of the westerly shear over the Southeast and the strong easterly shear to the south. Outflow is more apt to be greater than normal between the two, and we saw that in 2024.
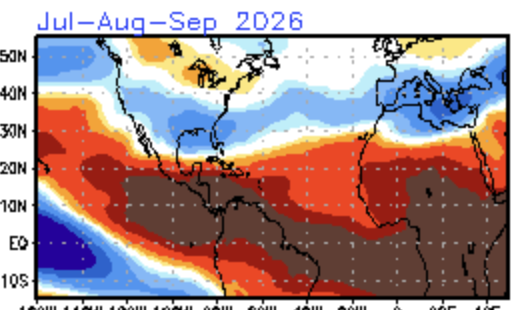
This season is the antilog to that, however, with warm water split in the Atlantic and a stronger El Niño:

So is the shear pattern:
The Sea Level Pressure forecast is not favorable either, implying stronger than average low-level easterlies in the Main Development Region at the height of the season:
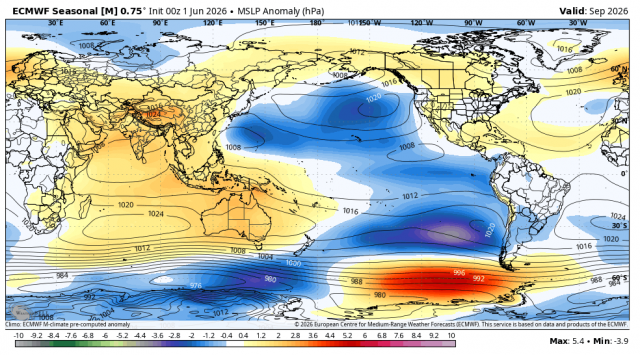
That would increase shear.
There is no stopping this El Niño event, as the cumulative buildup of heat had been held back by the La Niña. It's coming gangbusters now:
.png)
This is ahead of 2015's pace:
.png)
The SOI is already in an El Niño in the 90-day period. It was moderate in May, and it's been strong over the last 30 days:

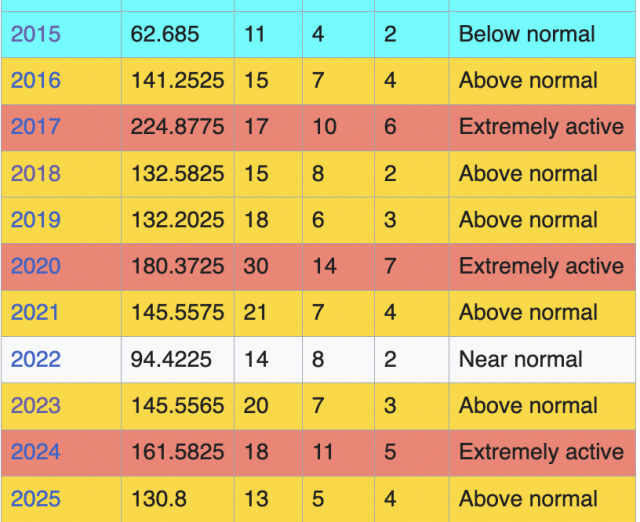
The Western Pacific Typhoon season has been remarkably quiet for the last few years, contributing to the overall downturn (slightly) of Global ACE. This is because the Western Pacific is home to close to 60% of the Northern Hemisphere's normal ACE. There have been only two extremely active years since 2015, and the busiest was 2015, our analog.

Remember, the normal is around 300. So I would prepare for a lot of activity in the Western Pacific. The Eastern Pacific looks normal to a bit above normal, and there will likely be some late-season landfalls on the Mexican coast. Hawaii also has to be wary, as El Niño years have been known to bring problems there.
The East Pacific can also be, as here are the numbers for 2015:
290.6 26 16 11 Extremely active The Verdict
The forecast numbers have not changed, as we were out there early with the less-than-average season idea. Now, using my shear method, I feel that despite the ACE being below normal overall, the northwestern Atlantic may be the one place that winds up seeing above normal activity. In the Gulf, there have been too many examples of hits or near-misses during El Niños to fit them into the large below-average area I have. My biggest concern is New England into the Maritimes, where a couple of storms would have them above normal ACE.
we